
Hello Traders
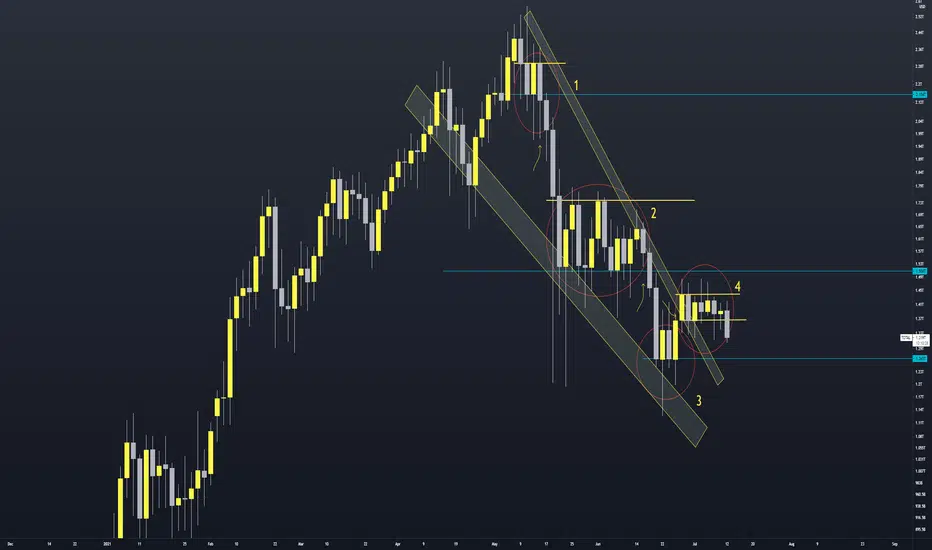
As you can see in the chart above, every red circle represents an important area in my opinion. As it is seen candle bodies in 2D chart are somehow important. When price is closed lower than a lower line (blue lines in each area), or above an upper line (yellow lines), it continued its way in that direction, almost sharply.
This point of view may be used in further areas found in 2D TOTAL chart.
------------------------------------------------------------------------
What is your opinion? Comment below.
If you like the idea, please hit the like button and follow me so that you won't miss the updates. The information given is never financial advice. Always do your research too.
Good luck.
As you can see in the chart above, every red circle represents an important area in my opinion. As it is seen candle bodies in 2D chart are somehow important. When price is closed lower than a lower line (blue lines in each area), or above an upper line (yellow lines), it continued its way in that direction, almost sharply.
This point of view may be used in further areas found in 2D TOTAL chart.
------------------------------------------------------------------------
What is your opinion? Comment below.
If you like the idea, please hit the like button and follow me so that you won't miss the updates. The information given is never financial advice. Always do your research too.
Good luck.

"You have to believe it before you see it."
Pernyataan Penyangkalan
Informasi dan publikasi ini tidak dimaksudkan, dan bukan merupakan, saran atau rekomendasi keuangan, investasi, trading, atau jenis lainnya yang diberikan atau didukung oleh TradingView. Baca selengkapnya di Ketentuan Penggunaan.
"You have to believe it before you see it."
Pernyataan Penyangkalan
Informasi dan publikasi ini tidak dimaksudkan, dan bukan merupakan, saran atau rekomendasi keuangan, investasi, trading, atau jenis lainnya yang diberikan atau didukung oleh TradingView. Baca selengkapnya di Ketentuan Penggunaan.