
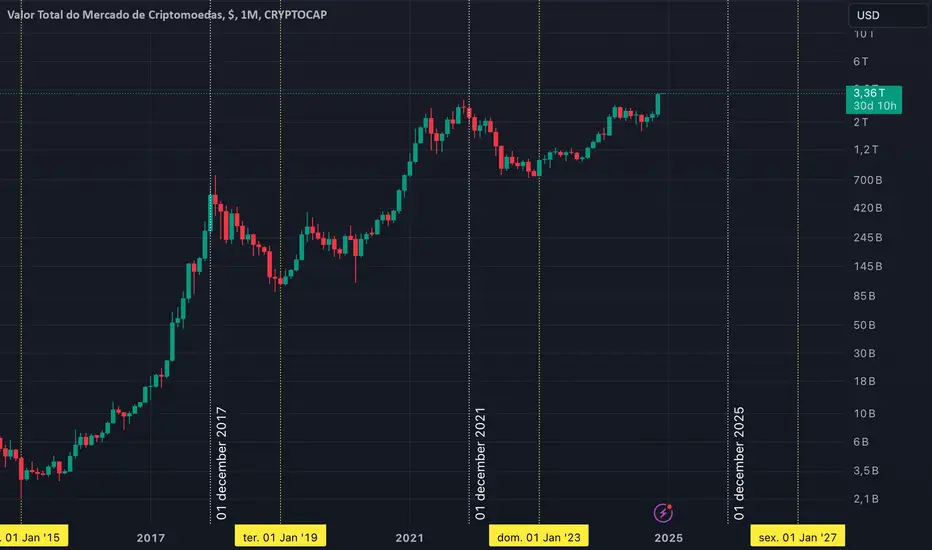
If the pattern repeats one more time, we are exactly one year away from the all-time high (ATH) of the crypto market cap 🚀✨📈
It's incredible how the growth of the total crypto market cap has followed a pattern since 2015. In the chart:
* White lines: market tops (always in December);
* Yellow lines: market bottoms (always in January);
The cycle is clear: two years from bottom to top and two years from top to bottom, completing a full cycle every four years.
If the pattern holds, we are exactly one year away from a ATH crypto market cap, likely in December 2025, followed by a possible bottom in January 2027. This isn’t a prediction, but a trend worth watching closely.
DYOR
It's incredible how the growth of the total crypto market cap has followed a pattern since 2015. In the chart:
* White lines: market tops (always in December);
* Yellow lines: market bottoms (always in January);
The cycle is clear: two years from bottom to top and two years from top to bottom, completing a full cycle every four years.
If the pattern holds, we are exactly one year away from a ATH crypto market cap, likely in December 2025, followed by a possible bottom in January 2027. This isn’t a prediction, but a trend worth watching closely.
DYOR

Pernyataan Penyangkalan
Informasi dan publikasi ini tidak dimaksudkan, dan bukan merupakan, saran atau rekomendasi keuangan, investasi, trading, atau jenis lainnya yang diberikan atau didukung oleh TradingView. Baca selengkapnya di Ketentuan Penggunaan.
Pernyataan Penyangkalan
Informasi dan publikasi ini tidak dimaksudkan, dan bukan merupakan, saran atau rekomendasi keuangan, investasi, trading, atau jenis lainnya yang diberikan atau didukung oleh TradingView. Baca selengkapnya di Ketentuan Penggunaan.