
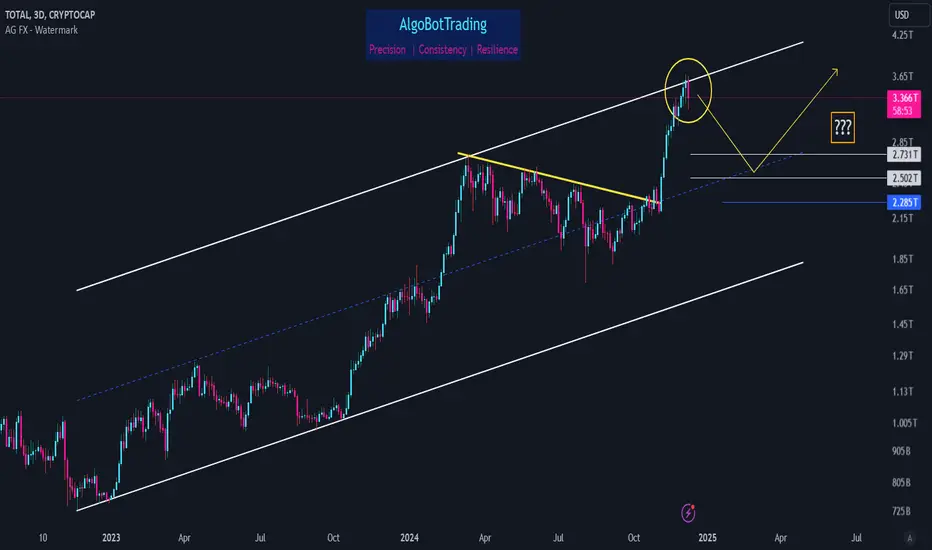
Sometimes a tool as simple as parallel channel can help us identify important support/resistance zones.
Looking at the chart, it's obvious that TOTAL reached 3.6T zone. Not only is this zone the area where a couple of fibs exist, but also it is indeed the upper boundary of the long term ascending channel.
Higher possibility scenario is to see a drop towards 2.5T - 2.73T zone before continuing the rally towards higher level. In order to keep its bullish integrity, TOTAL must not drop below 2.28T level.

Pernyataan Penyangkalan
Informasi dan publikasi ini tidak dimaksudkan, dan bukan merupakan, saran atau rekomendasi keuangan, investasi, trading, atau jenis lainnya yang diberikan atau didukung oleh TradingView. Baca selengkapnya di Ketentuan Penggunaan.
Pernyataan Penyangkalan
Informasi dan publikasi ini tidak dimaksudkan, dan bukan merupakan, saran atau rekomendasi keuangan, investasi, trading, atau jenis lainnya yang diberikan atau didukung oleh TradingView. Baca selengkapnya di Ketentuan Penggunaan.