
TOTAL2: Four-Year Reaccumulation Under the 1.33T Ceiling
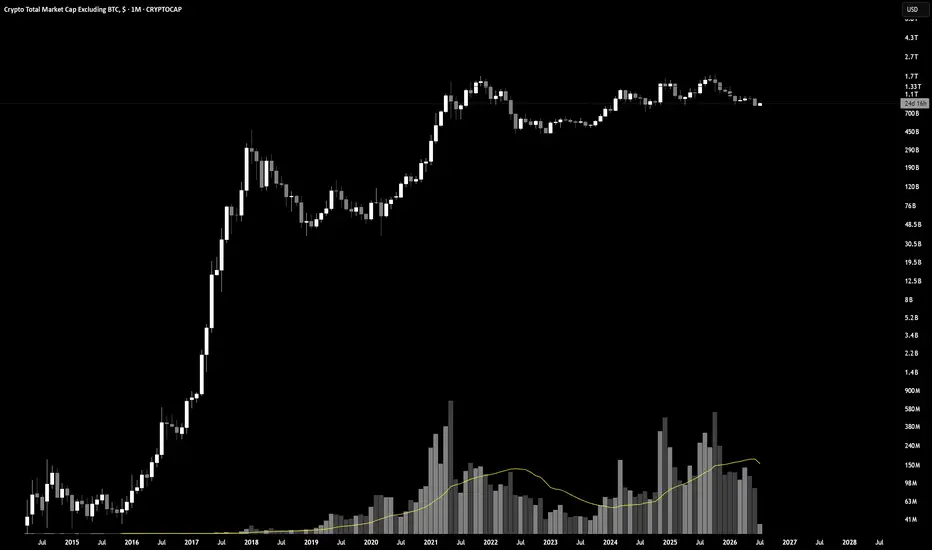
This is the widest possible lens on altcoin market cap, and the pattern only shows up at this zoom level. The 2017 cycle built one range, the 2021 peak built the next ceiling, and everything since has been compressing beneath that same 1.33T level for four straight years.
That's not distribution. Distribution would show declining lower highs into weaker and weaker bounces. This shows the opposite, repeated tests of the same ceiling with higher lows underneath each one, 2022's low, then 2023's, then a shallower base into 2024 and 2025. Each successive floor sits higher than the last.
In Wyckoff terms, this is a bull flag playing out as a multi-year reaccumulation schematic. The 2021 impulse was the initial markup. Everything since has been the market absorbing that move and building a new cause before the next effect, exactly the structure Continuation Acceleration Protocol treats as a regime gate still closed rather than a failed trend.
Volume tells the same story. The MA has been grinding higher since 2023 even as price has gone nowhere in absolute terms, participation quietly building underneath a flat price structure. That's classic absorption, aggressive selling met by aggressive buying at a level, without the level itself giving way.
The ceiling has rejected every test since 2021. That includes this cycle's most recent push. Until TOTAL2 closes a monthly candle above 1.33T with the range behind it instead of underneath it, this remains a base, not a breakout.
What invalidates the bullish read: a monthly close back below the 2024-2025 higher low structure, which would flatten the staircase and reopen the case for distribution instead. What confirms it: a monthly close above 1.33T, ideally with the volume expansion this base has been quietly building toward.
Marcus Aurelius wrote that the impediment to action advances action. Four years of failing to clear one number is either the longest rejection in crypto history or the longest base. The chart doesn't decide which. The next monthly close does.
That's not distribution. Distribution would show declining lower highs into weaker and weaker bounces. This shows the opposite, repeated tests of the same ceiling with higher lows underneath each one, 2022's low, then 2023's, then a shallower base into 2024 and 2025. Each successive floor sits higher than the last.
In Wyckoff terms, this is a bull flag playing out as a multi-year reaccumulation schematic. The 2021 impulse was the initial markup. Everything since has been the market absorbing that move and building a new cause before the next effect, exactly the structure Continuation Acceleration Protocol treats as a regime gate still closed rather than a failed trend.
Volume tells the same story. The MA has been grinding higher since 2023 even as price has gone nowhere in absolute terms, participation quietly building underneath a flat price structure. That's classic absorption, aggressive selling met by aggressive buying at a level, without the level itself giving way.
The ceiling has rejected every test since 2021. That includes this cycle's most recent push. Until TOTAL2 closes a monthly candle above 1.33T with the range behind it instead of underneath it, this remains a base, not a breakout.
What invalidates the bullish read: a monthly close back below the 2024-2025 higher low structure, which would flatten the staircase and reopen the case for distribution instead. What confirms it: a monthly close above 1.33T, ideally with the volume expansion this base has been quietly building toward.
Marcus Aurelius wrote that the impediment to action advances action. Four years of failing to clear one number is either the longest rejection in crypto history or the longest base. The chart doesn't decide which. The next monthly close does.

Charles V. — The Chart Whisperer
10+ years live BTC & ETH perpetuals. Elliott Wave, Wyckoff, Institutional Order Flow — integrated into one rules-based framework.
Full system: chartwhisperer.ca
10+ years live BTC & ETH perpetuals. Elliott Wave, Wyckoff, Institutional Order Flow — integrated into one rules-based framework.
Full system: chartwhisperer.ca
Publikasi terkait
Pernyataan Penyangkalan
Informasi dan publikasi ini tidak dimaksudkan, dan bukan merupakan, saran atau rekomendasi keuangan, investasi, trading, atau jenis lainnya yang diberikan atau didukung oleh TradingView. Baca selengkapnya di Ketentuan Penggunaan.
Charles V. — The Chart Whisperer
10+ years live BTC & ETH perpetuals. Elliott Wave, Wyckoff, Institutional Order Flow — integrated into one rules-based framework.
Full system: chartwhisperer.ca
10+ years live BTC & ETH perpetuals. Elliott Wave, Wyckoff, Institutional Order Flow — integrated into one rules-based framework.
Full system: chartwhisperer.ca
Publikasi terkait
Pernyataan Penyangkalan
Informasi dan publikasi ini tidak dimaksudkan, dan bukan merupakan, saran atau rekomendasi keuangan, investasi, trading, atau jenis lainnya yang diberikan atau didukung oleh TradingView. Baca selengkapnya di Ketentuan Penggunaan.