
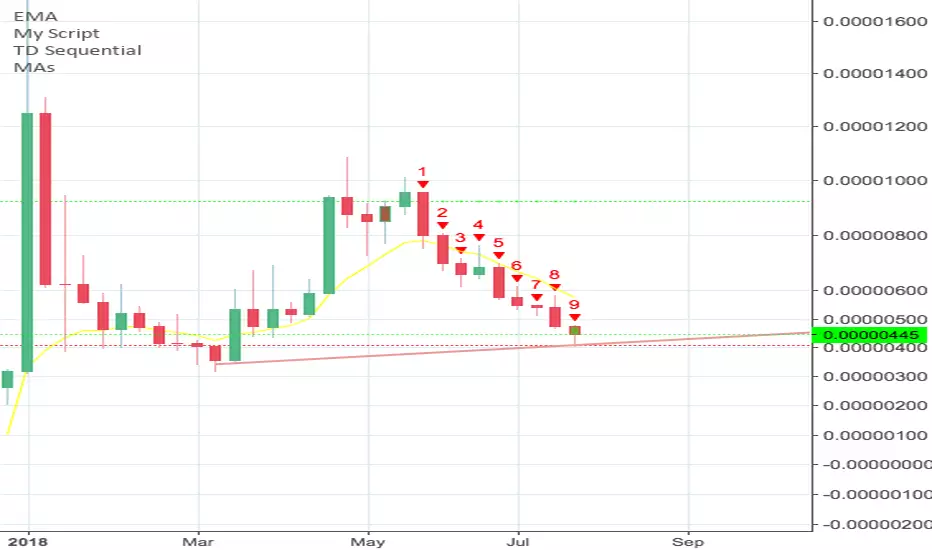
According to the 'Weekly' chart of Tron (TRX), using the TD-Sequential system, we are on a red '9' of '9', which means a correction or reversal is more than likely about to occur after the closing this current '9' candle.
With the launch of Tron's Mainnet, its my belief that a bull-run is around the corner.
I'm not a financial advisor, but I'm long on Tron.
Good luck if you enter this trade!
With the launch of Tron's Mainnet, its my belief that a bull-run is around the corner.
I'm not a financial advisor, but I'm long on Tron.
Good luck if you enter this trade!
Catatan
Looking at the 'Weekly' chart below: Using the TD-Sequential indicator system, It looks like the red '9' candle gave us a beautiful "Reversal" candle.I believe the blue line with the arrow will act as a support line for TRX. I'm also using a 100-day SMA (Simple Moving Average)
WEEKLY CHART:
Now let's take a look at the daily chart below: As you can see, we had a very bullish-run in late March and the month of April. We've now been in a declining, bearish market since the beginning of June.
We really can't tell much from looking at the 'daily' chart; However, we are on a green '2' of '9' candle. One more thing to note about this daily chart is the 20-day SMA has been a great Support and Resistance line in the past.
DAILY CHART:

Pernyataan Penyangkalan
Informasi dan publikasi ini tidak dimaksudkan, dan bukan merupakan, saran atau rekomendasi keuangan, investasi, trading, atau jenis lainnya yang diberikan atau didukung oleh TradingView. Baca selengkapnya di Ketentuan Penggunaan.
Pernyataan Penyangkalan
Informasi dan publikasi ini tidak dimaksudkan, dan bukan merupakan, saran atau rekomendasi keuangan, investasi, trading, atau jenis lainnya yang diberikan atau didukung oleh TradingView. Baca selengkapnya di Ketentuan Penggunaan.