
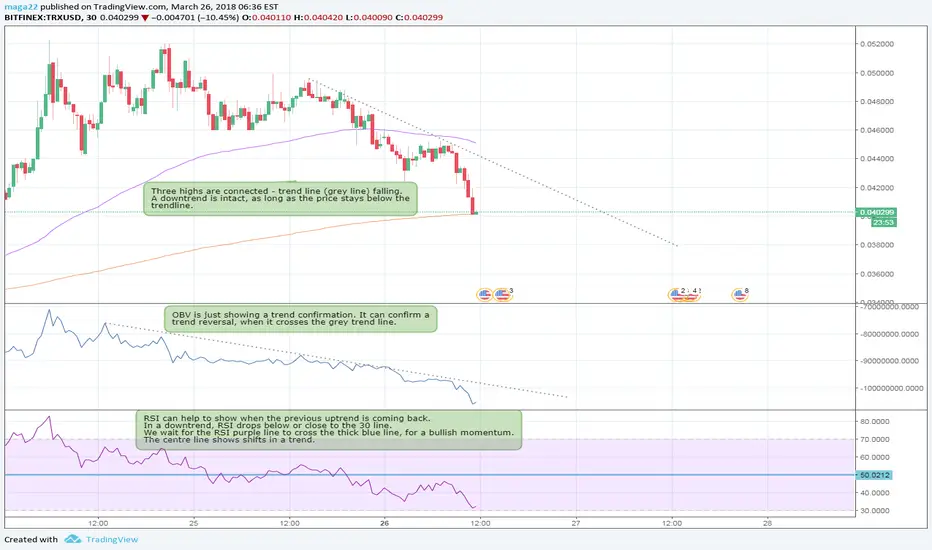
Everything confirms and shows a downtrend, but looking at the trendlines and centre line for the RSI indicator. It seems that we can perhaps hope for a reversal soon
IF
1.Candle stick crosses the grey dotted line and we see higher highs.
2.OBV line crosses grey dotted line and we see an increase
3.RSI crosses centre line (50) for a bullish momentum.
Do you agree with me? If not, please let me know how you would analyse it.
Thanks!
IF
1.Candle stick crosses the grey dotted line and we see higher highs.
2.OBV line crosses grey dotted line and we see an increase
3.RSI crosses centre line (50) for a bullish momentum.
Do you agree with me? If not, please let me know how you would analyse it.
Thanks!

Pernyataan Penyangkalan
Informasi dan publikasi ini tidak dimaksudkan, dan bukan merupakan, saran atau rekomendasi keuangan, investasi, trading, atau jenis lainnya yang diberikan atau didukung oleh TradingView. Baca selengkapnya di Ketentuan Penggunaan.
Pernyataan Penyangkalan
Informasi dan publikasi ini tidak dimaksudkan, dan bukan merupakan, saran atau rekomendasi keuangan, investasi, trading, atau jenis lainnya yang diberikan atau didukung oleh TradingView. Baca selengkapnya di Ketentuan Penggunaan.