
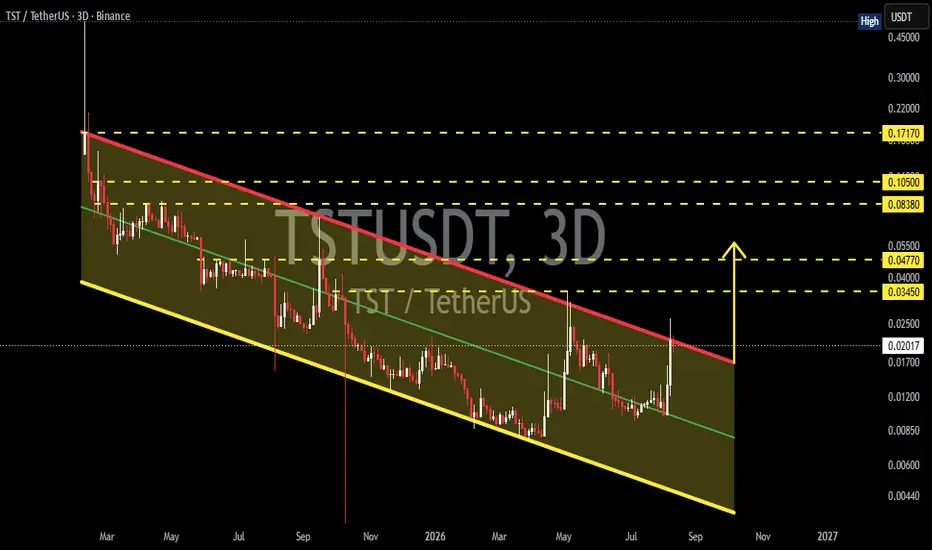
🔎📊 Technical Analysis
💵 Coin: TST #TST
⌛ Time Frame: 3D
📉 Pattern: 🔻 Descending Channel
📍 Current Price: around $0.0203
🎯 Major Resistance: $0.0345 → $0.0477
🚀 Extended Target: $0.0838 → $0.1050 → $0.1717
---
📐🔻 DESCENDING CHANNEL
📊 The chart shows a long-standing 🔻 Descending Channel, with price moving between two major trendlines:
🔴 Upper Descending Trendline — acting as the main dynamic resistance and an extremely important level to watch for confirmation.
🟡 Lower Descending Trendline — acting as the dynamic support / channel floor.
📉 As long as price remains inside the channel, the broader structure continues to indicate a downtrend, characterized by:
🔻 Lower Highs
🔻 Lower Lows
🔻 Rejections at the upper trendline
🔻 Price movement remaining contained within the channel
⚠️ However, there is an important development: price is starting to recover from the lower part of the channel and is moving back toward the upper trendline. 👀🔥
---
🟢🚀 BULLISH SCENARIO
🔥 IfTST manages to break above the upper descending trendline with a strong 3D candle, this pattern could potentially trigger a bullish breakout 🚀📈
✅🔥 Key Confirmation:
🟢 Breakout of the resistance / upper trendline
🕯️ 3D candle close above the trendline
📊 Volume increases during the breakout
🔄 Successful retest, with the trendline turning into support
💪 Buyers maintain price above the breakout area
If the breakout is properly confirmed, the following resistance areas could become potential targets 🎯👇
🎯 $0.0345 — 🟡 First resistance
🎯 $0.0477 — 🟠 Next resistance
🚀 $0.0838 — 🔴 Major resistance
🚀 $0.1050 — 🔥 Higher resistance
💥 $0.1717 — 🚀 Extended target / major historical resistance
⚠️ The $0.0345–$0.0477 zone is particularly important, as this area could attract sellers again. 👀📊
---
🔴📉 BEARISH SCENARIO
⚠️ If price fails to break above the upper descending trendline, another rejection remains highly possible. 📉
🔴 Price gets rejected from resistance
❌ Breakout fails / False Breakout
🕯️ 3D candle closes back below the trendline
📊 Selling volume increases
🐻 Sellers regain control
Under these conditions,TST could continue moving within the Descending Channel structure. 🔻📉
📉 Structural Downside Targets:
➡️ 🟡 Mid-channel / dynamic support
➡️ 🔻 $0.0120 area
➡️ 🔻 $0.0085 area
➡️ ⚠️ If selling pressure becomes very strong, price could retest the lower channel boundary.
🚨 As long as the upper trendline has not been validly broken, the Descending Channel remains technically intact.
---
⚡🔥 KEY AREAS TO WATCH
📍 $0.0203 — 💵 Current price shown on the chart.
🔴 Upper Trendline — 🚧 Main dynamic resistance.
🟢 $0.0345 — 🎯 First major resistance after a breakout.
🟢 $0.0477 — 🎯 Next key resistance / target.
🚀 $0.0838 — 🔥 Major resistance.
🚀 $0.1050 — 💥 Higher resistance.
🔥 $0.1717 — 🚀 Long-term extended target.
---
🧠📌 CONCLUSION
TST is currently at a very important phase within the Descending Channel. 👀📊
📉 Structurally, the trend remains bearish as long as price stays below the upper descending trendline.
However, the recovery from the lower part of the channel makes a breakout scenario very important to watch. 🔥🚀
🟢🚀 BULLISH CONFIRMATION:
💥 Breakout + 3D Close + Volume Confirmation
⬇️
🔄 Successful Retest
⬇️
🎯 $0.0345 → $0.0477
⬇️
🚀 $0.0838 → $0.1050
⬇️
🔥 $0.1717
🔴🐻 BEARISH CONFIRMATION:
❌ Rejection from the upper trendline
⬇️
📉 False breakout / breakdown
⬇️
🔻 Price returns inside the channel
⬇️
🎯 $0.0120 → $0.0085
⬇️
⚠️ Potential retest of the lower channel
---
🎯🔥 KEY LEVELS
🟢 $0.0345
➡️ First Major Resistance
🟢 $0.0477
➡️ Key Resistance / Breakout Target
🚀 $0.0838
➡️ Major Resistance
🔥 $0.1050
➡️ Higher Resistance
💥 $0.1717
➡️ Extended Long-Term Target
---
👀🔥 WATCH THE BREAKOUT!
📈 The upper channel resistance is the KEY.
🟢 Valid breakout = potential trend reversal / expansion move 🚀
🔴 Rejection = Descending Channel remains active 📉
⚠️ Confirmation is more important than anticipation.
---
#TST #TSTUSDT #Crypto #CryptoAnalysis #TechnicalAnalysis #CryptoTrading #Altcoins #AltcoinAnalysis #DescendingChannel #Breakout #BullishBreakout #Bearish #CryptoMarket #PriceAction #CryptoSignals #TradingSetup #MarketAnalysis
💵 Coin:
TST #TST⌛ Time Frame: 3D
📉 Pattern: 🔻 Descending Channel
📍 Current Price: around $0.0203
🎯 Major Resistance: $0.0345 → $0.0477
🚀 Extended Target: $0.0838 → $0.1050 → $0.1717
---
📐🔻 DESCENDING CHANNEL
📊 The chart shows a long-standing 🔻 Descending Channel, with price moving between two major trendlines:
🔴 Upper Descending Trendline — acting as the main dynamic resistance and an extremely important level to watch for confirmation.
🟡 Lower Descending Trendline — acting as the dynamic support / channel floor.
📉 As long as price remains inside the channel, the broader structure continues to indicate a downtrend, characterized by:
🔻 Lower Highs
🔻 Lower Lows
🔻 Rejections at the upper trendline
🔻 Price movement remaining contained within the channel
⚠️ However, there is an important development: price is starting to recover from the lower part of the channel and is moving back toward the upper trendline. 👀🔥
---
🟢🚀 BULLISH SCENARIO
🔥 If
TST manages to break above the upper descending trendline with a strong 3D candle, this pattern could potentially trigger a bullish breakout 🚀📈✅🔥 Key Confirmation:
🟢 Breakout of the resistance / upper trendline
🕯️ 3D candle close above the trendline
📊 Volume increases during the breakout
🔄 Successful retest, with the trendline turning into support
💪 Buyers maintain price above the breakout area
If the breakout is properly confirmed, the following resistance areas could become potential targets 🎯👇
🎯 $0.0345 — 🟡 First resistance
🎯 $0.0477 — 🟠 Next resistance
🚀 $0.0838 — 🔴 Major resistance
🚀 $0.1050 — 🔥 Higher resistance
💥 $0.1717 — 🚀 Extended target / major historical resistance
⚠️ The $0.0345–$0.0477 zone is particularly important, as this area could attract sellers again. 👀📊
---
🔴📉 BEARISH SCENARIO
⚠️ If price fails to break above the upper descending trendline, another rejection remains highly possible. 📉
🔴 Price gets rejected from resistance
❌ Breakout fails / False Breakout
🕯️ 3D candle closes back below the trendline
📊 Selling volume increases
🐻 Sellers regain control
Under these conditions,
TST could continue moving within the Descending Channel structure. 🔻📉📉 Structural Downside Targets:
➡️ 🟡 Mid-channel / dynamic support
➡️ 🔻 $0.0120 area
➡️ 🔻 $0.0085 area
➡️ ⚠️ If selling pressure becomes very strong, price could retest the lower channel boundary.
🚨 As long as the upper trendline has not been validly broken, the Descending Channel remains technically intact.
---
⚡🔥 KEY AREAS TO WATCH
📍 $0.0203 — 💵 Current price shown on the chart.
🔴 Upper Trendline — 🚧 Main dynamic resistance.
🟢 $0.0345 — 🎯 First major resistance after a breakout.
🟢 $0.0477 — 🎯 Next key resistance / target.
🚀 $0.0838 — 🔥 Major resistance.
🚀 $0.1050 — 💥 Higher resistance.
🔥 $0.1717 — 🚀 Long-term extended target.
---
🧠📌 CONCLUSION
TST is currently at a very important phase within the Descending Channel. 👀📊📉 Structurally, the trend remains bearish as long as price stays below the upper descending trendline.
However, the recovery from the lower part of the channel makes a breakout scenario very important to watch. 🔥🚀
🟢🚀 BULLISH CONFIRMATION:
💥 Breakout + 3D Close + Volume Confirmation
⬇️
🔄 Successful Retest
⬇️
🎯 $0.0345 → $0.0477
⬇️
🚀 $0.0838 → $0.1050
⬇️
🔥 $0.1717
🔴🐻 BEARISH CONFIRMATION:
❌ Rejection from the upper trendline
⬇️
📉 False breakout / breakdown
⬇️
🔻 Price returns inside the channel
⬇️
🎯 $0.0120 → $0.0085
⬇️
⚠️ Potential retest of the lower channel
---
🎯🔥 KEY LEVELS
🟢 $0.0345
➡️ First Major Resistance
🟢 $0.0477
➡️ Key Resistance / Breakout Target
🚀 $0.0838
➡️ Major Resistance
🔥 $0.1050
➡️ Higher Resistance
💥 $0.1717
➡️ Extended Long-Term Target
---
👀🔥 WATCH THE BREAKOUT!
📈 The upper channel resistance is the KEY.
🟢 Valid breakout = potential trend reversal / expansion move 🚀
🔴 Rejection = Descending Channel remains active 📉
⚠️ Confirmation is more important than anticipation.
---
#TST #TSTUSDT #Crypto #CryptoAnalysis #TechnicalAnalysis #CryptoTrading #Altcoins #AltcoinAnalysis #DescendingChannel #Breakout #BullishBreakout #Bearish #CryptoMarket #PriceAction #CryptoSignals #TradingSetup #MarketAnalysis

✅ Get Free Signals! Join Our Telegram Channel Here: t.me/TheCryptoNuclear
✅ Twitter: twitter.com/crypto_nuclear
✅ Join Bybit : partner.bybit.com/b/nuclearvip
✅ Benefits : Lifetime Trading Fee Discount -50%
✅ Twitter: twitter.com/crypto_nuclear
✅ Join Bybit : partner.bybit.com/b/nuclearvip
✅ Benefits : Lifetime Trading Fee Discount -50%
Pernyataan Penyangkalan
Informasi dan publikasi ini tidak dimaksudkan, dan bukan merupakan, saran atau rekomendasi keuangan, investasi, trading, atau jenis lainnya yang diberikan atau didukung oleh TradingView. Baca selengkapnya di Ketentuan Penggunaan.