UK 100 ( UK100) Daily: All-Time High Test at 10,948 — Genuine Breakout Retest vs. Institutional Bull Trap (Two-Way Matrix)
### 🇬🇧 FTSE 100 Index (UK100) Daily Technical Framework (Ref: UK100_2026-07-30_08-57-56.png)
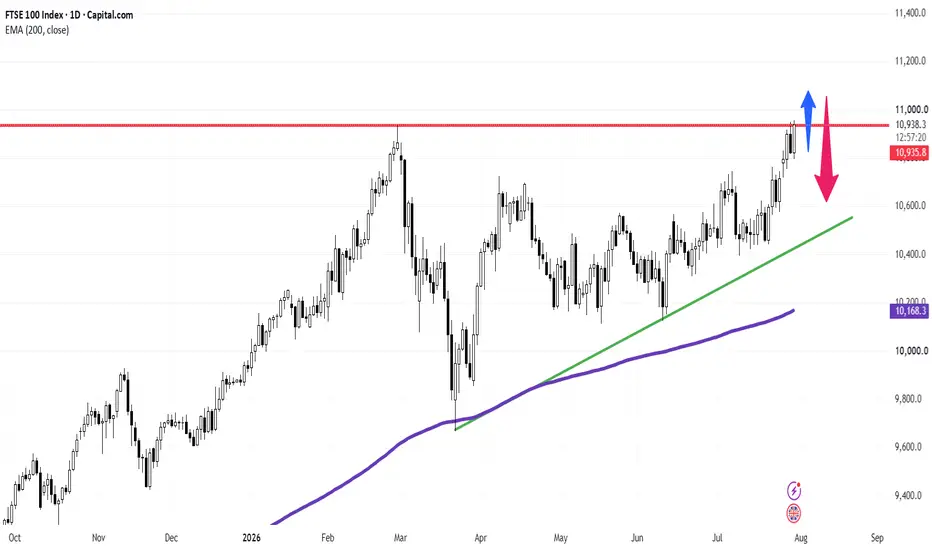
We are deploying a strategic daily (1D) structural framework on the UK FTSE 100 Index (UK100). The benchmark index is currently pressing directly against its all-time high resistance barrier, setting up a high-volatility decision node between genuine trend expansion and an institutional liquidity sweep.
The index is trading with strong bullish momentum today at **10,948.0 (+1.15%)**, testing the major horizontal resistance ceiling at **10,935.8 – 10,948.0**.
---
### 🔍 Market Microstructure & Dual-Path Dynamics:
Testing record territory creates a textbook junction between retail breakout mechanics and institutional liquidity hunting:
1. **Scenario A — Genuine Breakout & Retest (Blue Vector):**
* **Mechanics:** The ideal bullish scenario requires a decisive daily close above the **10,948.0** historical pivot. A subsequent controlled pullback (*throwback*) that holds the breakout level as new support, followed by a strong expansion candle, validates the trend continuation toward the **11,000+** psychological threshold.
2. **Scenario B — Institutional Bull Trap / Liquidity Sweep (Red Vector):**
* **Mechanics:** Institutional market makers often push price temporarily above key record levels to trigger retail buy-stops and stop-loss orders. If aggressive sell-side supply immediately absorbs this demand and closes the daily candle back below **10,935.8**, a sharp rejection (*fakeout*) will follow, driving a corrective leg toward the ascending trendline support (green LTA baseline) and the **10,168.4** 200-EMA.
---
### 🛡️ Tactical Risk Management Protocol:
At historical inflection points, waiting for daily candle close confirmation is essential to align with high-probability positioning:
* **Overhead Resistance Pivot:** 10,935.8 – 10,948.0 (All-Time High Ceiling)
* **Bullish Expansion Trigger:** Daily close above 10,948.0 followed by a successful throwback hold.
* **Bearish Rejection Trigger:** Daily close below 10,935.8 with long upper rejection wick.
* **Macro Baseline Floor:** Ascending green trendline & 10,168.4 (200-EMA Anchor).
### 📊 Tactical Parameters Summary:
* **Current Bias:** Neutral / Awaiting Daily Close Confirmation
* **Critical Resistance Ceiling:** 10,948.0
* **Upside Expansion Target:** 11,000.0+
* **Downside Rejection Target:** Ascending LTA Baseline (~10,500.0)
* **Institutional Trend Floor:** 10,168.4 (200-EMA)
---
📊 **ChartPro Data**
*UK Equity Architecture, Breakout Microstructure & Systematic Risk Management.*
⚠️ **Disclaimer:** For educational and informational purposes only. This active market study represents a personal trading framework and does not constitute financial or investment advice.
UK100) Daily: All-Time High Test at 10,948 — Genuine Breakout Retest vs. Institutional Bull Trap (Two-Way Matrix)### 🇬🇧 FTSE 100 Index (
UK100) Daily Technical Framework (Ref: UK100_2026-07-30_08-57-56.png)We are deploying a strategic daily (1D) structural framework on the UK FTSE 100 Index (
UK100). The benchmark index is currently pressing directly against its all-time high resistance barrier, setting up a high-volatility decision node between genuine trend expansion and an institutional liquidity sweep.The index is trading with strong bullish momentum today at **10,948.0 (+1.15%)**, testing the major horizontal resistance ceiling at **10,935.8 – 10,948.0**.
---
### 🔍 Market Microstructure & Dual-Path Dynamics:
Testing record territory creates a textbook junction between retail breakout mechanics and institutional liquidity hunting:
1. **Scenario A — Genuine Breakout & Retest (Blue Vector):**
* **Mechanics:** The ideal bullish scenario requires a decisive daily close above the **10,948.0** historical pivot. A subsequent controlled pullback (*throwback*) that holds the breakout level as new support, followed by a strong expansion candle, validates the trend continuation toward the **11,000+** psychological threshold.
2. **Scenario B — Institutional Bull Trap / Liquidity Sweep (Red Vector):**
* **Mechanics:** Institutional market makers often push price temporarily above key record levels to trigger retail buy-stops and stop-loss orders. If aggressive sell-side supply immediately absorbs this demand and closes the daily candle back below **10,935.8**, a sharp rejection (*fakeout*) will follow, driving a corrective leg toward the ascending trendline support (green LTA baseline) and the **10,168.4** 200-EMA.
---
### 🛡️ Tactical Risk Management Protocol:
At historical inflection points, waiting for daily candle close confirmation is essential to align with high-probability positioning:
* **Overhead Resistance Pivot:** 10,935.8 – 10,948.0 (All-Time High Ceiling)
* **Bullish Expansion Trigger:** Daily close above 10,948.0 followed by a successful throwback hold.
* **Bearish Rejection Trigger:** Daily close below 10,935.8 with long upper rejection wick.
* **Macro Baseline Floor:** Ascending green trendline & 10,168.4 (200-EMA Anchor).
### 📊 Tactical Parameters Summary:
* **Current Bias:** Neutral / Awaiting Daily Close Confirmation
* **Critical Resistance Ceiling:** 10,948.0
* **Upside Expansion Target:** 11,000.0+
* **Downside Rejection Target:** Ascending LTA Baseline (~10,500.0)
* **Institutional Trend Floor:** 10,168.4 (200-EMA)
---
📊 **ChartPro Data**
*UK Equity Architecture, Breakout Microstructure & Systematic Risk Management.*
⚠️ **Disclaimer:** For educational and informational purposes only. This active market study represents a personal trading framework and does not constitute financial or investment advice.

Pernyataan Penyangkalan
Informasi dan publikasi ini tidak dimaksudkan, dan bukan merupakan, saran atau rekomendasi keuangan, investasi, trading, atau jenis lainnya yang diberikan atau didukung oleh TradingView. Baca selengkapnya di Ketentuan Penggunaan.
Pernyataan Penyangkalan
Informasi dan publikasi ini tidak dimaksudkan, dan bukan merupakan, saran atau rekomendasi keuangan, investasi, trading, atau jenis lainnya yang diberikan atau didukung oleh TradingView. Baca selengkapnya di Ketentuan Penggunaan.