
Trend: Improving (still inside a falling channel until breakout)
Momentum: Bullish
Pattern: Falling Channel Breakout Attempt
Action: Watch for a decisive daily close above ₹1,380–1,390 with above-average volume. A confirmed breakout could signal the start of a new uptrend, while rejection at this level may lead to a short-term pullback before another attempt.
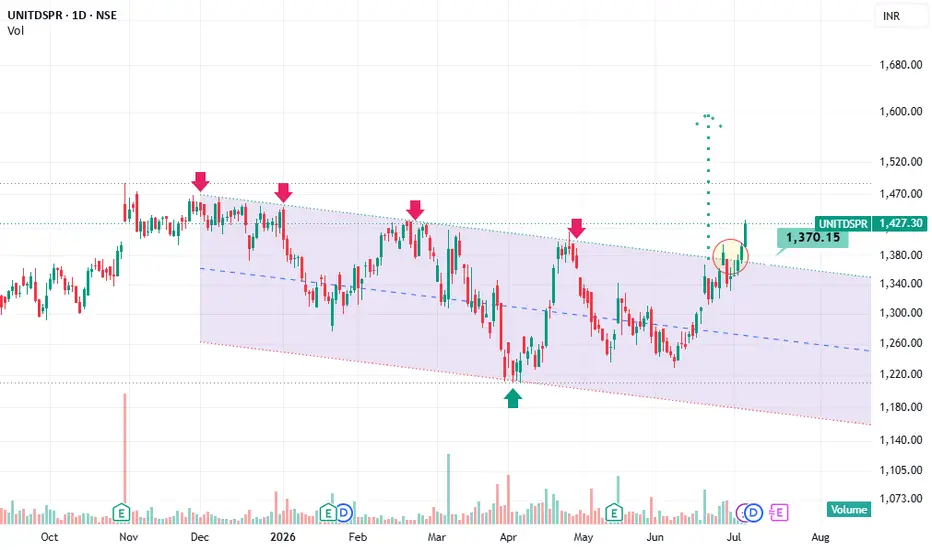
The chart shows that the stock has been trading inside a falling channel for several months and is now attempting to break above the upper trendline.
Key Observations
1. Falling Channel Formation (Bearish Structure)
The stock has been making lower highs and lower lows since November.
The pink arrows indicate multiple rejections from the upper resistance line.
The green arrow marks the channel support, where buyers stepped in and reversed the trend.
Interpretation: The long-term downtrend is losing momentum as buyers are becoming more aggressive.
2. Strong Recovery from Support
After touching around ₹1,200, the stock rallied sharply.
Price has moved above the channel's midline with strong bullish candles.
This indicates improving momentum.
3. Current Resistance Zone (Circled Area)
The circled candle is testing the upper boundary of the channel near ₹1,370–1,385.
This is an important level because:
Previous rallies have failed here.
Sellers have repeatedly entered at this trendline.
4. Volume Analysis
Volume has increased during the recent rally.
Higher volume near resistance suggests strong participation.
However, confirmation is needed through a breakout.
Possible Scenarios
✅ Bullish Scenario
If the stock closes above ₹1,380–1,390 with strong volume:
Falling channel breakout will be confirmed.
Fresh buying momentum may emerge.
Possible targets:
₹1,470
₹1,550
₹1,600 (marked by the dotted projection)
⚠️ Bearish Scenario
If the stock fails to break the trendline:
Profit booking may occur.
Price could retrace towards:
₹1,340
₹1,300
Channel midline support
Momentum: Bullish
Pattern: Falling Channel Breakout Attempt
Action: Watch for a decisive daily close above ₹1,380–1,390 with above-average volume. A confirmed breakout could signal the start of a new uptrend, while rejection at this level may lead to a short-term pullback before another attempt.
The chart shows that the stock has been trading inside a falling channel for several months and is now attempting to break above the upper trendline.
Key Observations
1. Falling Channel Formation (Bearish Structure)
The stock has been making lower highs and lower lows since November.
The pink arrows indicate multiple rejections from the upper resistance line.
The green arrow marks the channel support, where buyers stepped in and reversed the trend.
Interpretation: The long-term downtrend is losing momentum as buyers are becoming more aggressive.
2. Strong Recovery from Support
After touching around ₹1,200, the stock rallied sharply.
Price has moved above the channel's midline with strong bullish candles.
This indicates improving momentum.
3. Current Resistance Zone (Circled Area)
The circled candle is testing the upper boundary of the channel near ₹1,370–1,385.
This is an important level because:
Previous rallies have failed here.
Sellers have repeatedly entered at this trendline.
4. Volume Analysis
Volume has increased during the recent rally.
Higher volume near resistance suggests strong participation.
However, confirmation is needed through a breakout.
Possible Scenarios
✅ Bullish Scenario
If the stock closes above ₹1,380–1,390 with strong volume:
Falling channel breakout will be confirmed.
Fresh buying momentum may emerge.
Possible targets:
₹1,470
₹1,550
₹1,600 (marked by the dotted projection)
⚠️ Bearish Scenario
If the stock fails to break the trendline:
Profit booking may occur.
Price could retrace towards:
₹1,340
₹1,300
Channel midline support

Pernyataan Penyangkalan
Informasi dan publikasi ini tidak dimaksudkan, dan bukan merupakan, saran atau rekomendasi keuangan, investasi, trading, atau jenis lainnya yang diberikan atau didukung oleh TradingView. Baca selengkapnya di Ketentuan Penggunaan.
Pernyataan Penyangkalan
Informasi dan publikasi ini tidak dimaksudkan, dan bukan merupakan, saran atau rekomendasi keuangan, investasi, trading, atau jenis lainnya yang diberikan atau didukung oleh TradingView. Baca selengkapnya di Ketentuan Penggunaan.