
# UPST (Upstart Holdings Inc.) Daily Chart Analysis – 6/1/26
### Company Information
Upstart Holdings operates an AI-driven lending platform that helps financial institutions evaluate borrowers using machine learning models. UPST remains one of the more volatile AI and fintech-related stocks in the market.
### Key Observations
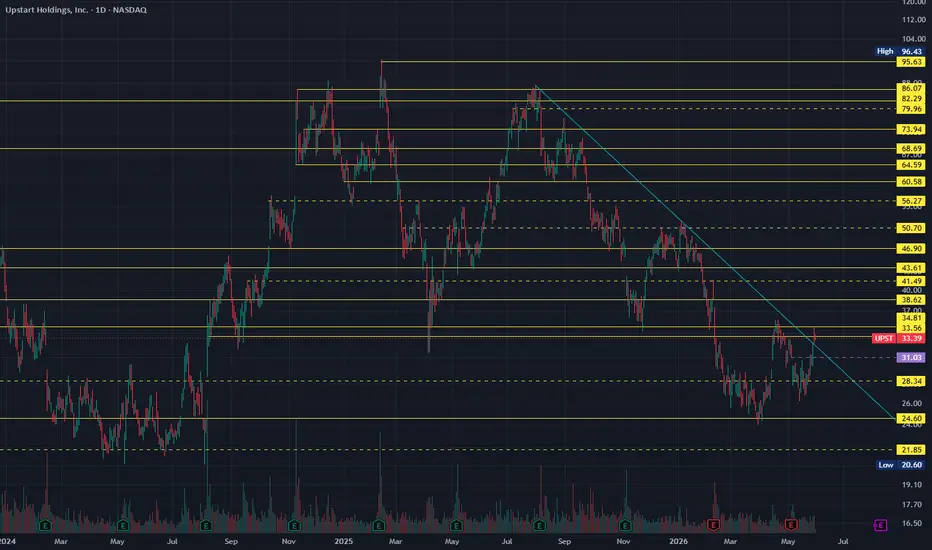
• UPST has been in a prolonged downtrend since the August 2025 highs near $86.
• The stock recently found support near the major historical demand zone between:
• $24.60
• $28.34
• Price has started to build a series of higher lows since the March bottom, suggesting selling pressure may be easing.
• The descending trendline from the 2025 highs remains the most important technical level on the chart.
• Current price action is sitting directly beneath trendline resistance, making the next move particularly important.
### Pattern Structure
• Multi-month descending trendline remains intact.
• Potential trend reversal is developing if buyers can break above:
• $33.56
• The descending trendline
• The stock appears to be transitioning from a bearish trend into a possible base-building phase.
• A successful breakout would create the first meaningful higher-high sequence seen in many months.
### Support & Resistance Levels
#### Resistance
• $33.56
• $38.62
• $41.49
• $43.61
• $46.90
• $50.70
• $56.27
#### Support
• $31.03
• $28.34
• $24.60
• $21.85
### Volume & Trend Notes
• Volume has remained relatively stable during the recent consolidation, which is constructive after the large decline.
• The stock has repeatedly defended the mid-$20s area, creating a potentially important accumulation zone.
• Buyers are now attempting to reclaim higher levels while compressing directly under descending trendline resistance.
• A breakout through the trendline would likely attract momentum traders back into the name.
### ✅ Trading Plan
#### Bullish Scenario
Trigger: Break and hold above $33.56 and the descending trendline
Targets:
• PT1: $38.62
• PT2: $41.49
• PT3: $43.61
• PT4: $46.90
• PT5: $50.70
Stop Loss:
• Close below $31.03
#### Bearish Scenario
Trigger: Rejection at trendline resistance and loss of $31.03
Targets:
• PT1: $28.34
• PT2: $24.60
• PT3: $21.85
Stop Loss:
• Reclaim above $33.56
### Summary
UPST is approaching a major decision point. After months of selling pressure, the stock has begun building a base above the $24-$28 support zone and is now testing a key descending trendline. A breakout above $33.56 would significantly improve the technical picture and could open the door toward the upper $30s and low $40s. Until that breakout occurs, the stock remains in a recovery attempt, but the chart is looking considerably healthier than it did just a few months ago.
### Company Information
Upstart Holdings operates an AI-driven lending platform that helps financial institutions evaluate borrowers using machine learning models. UPST remains one of the more volatile AI and fintech-related stocks in the market.
### Key Observations
• UPST has been in a prolonged downtrend since the August 2025 highs near $86.
• The stock recently found support near the major historical demand zone between:
• $24.60
• $28.34
• Price has started to build a series of higher lows since the March bottom, suggesting selling pressure may be easing.
• The descending trendline from the 2025 highs remains the most important technical level on the chart.
• Current price action is sitting directly beneath trendline resistance, making the next move particularly important.
### Pattern Structure
• Multi-month descending trendline remains intact.
• Potential trend reversal is developing if buyers can break above:
• $33.56
• The descending trendline
• The stock appears to be transitioning from a bearish trend into a possible base-building phase.
• A successful breakout would create the first meaningful higher-high sequence seen in many months.
### Support & Resistance Levels
#### Resistance
• $33.56
• $38.62
• $41.49
• $43.61
• $46.90
• $50.70
• $56.27
#### Support
• $31.03
• $28.34
• $24.60
• $21.85
### Volume & Trend Notes
• Volume has remained relatively stable during the recent consolidation, which is constructive after the large decline.
• The stock has repeatedly defended the mid-$20s area, creating a potentially important accumulation zone.
• Buyers are now attempting to reclaim higher levels while compressing directly under descending trendline resistance.
• A breakout through the trendline would likely attract momentum traders back into the name.
### ✅ Trading Plan
#### Bullish Scenario
Trigger: Break and hold above $33.56 and the descending trendline
Targets:
• PT1: $38.62
• PT2: $41.49
• PT3: $43.61
• PT4: $46.90
• PT5: $50.70
Stop Loss:
• Close below $31.03
#### Bearish Scenario
Trigger: Rejection at trendline resistance and loss of $31.03
Targets:
• PT1: $28.34
• PT2: $24.60
• PT3: $21.85
Stop Loss:
• Reclaim above $33.56
### Summary
UPST is approaching a major decision point. After months of selling pressure, the stock has begun building a base above the $24-$28 support zone and is now testing a key descending trendline. A breakout above $33.56 would significantly improve the technical picture and could open the door toward the upper $30s and low $40s. Until that breakout occurs, the stock remains in a recovery attempt, but the chart is looking considerably healthier than it did just a few months ago.

Pernyataan Penyangkalan
Informasi dan publikasi ini tidak dimaksudkan, dan bukan merupakan, saran atau rekomendasi keuangan, investasi, trading, atau jenis lainnya yang diberikan atau didukung oleh TradingView. Baca selengkapnya di Ketentuan Penggunaan.
Pernyataan Penyangkalan
Informasi dan publikasi ini tidak dimaksudkan, dan bukan merupakan, saran atau rekomendasi keuangan, investasi, trading, atau jenis lainnya yang diberikan atau didukung oleh TradingView. Baca selengkapnya di Ketentuan Penggunaan.