
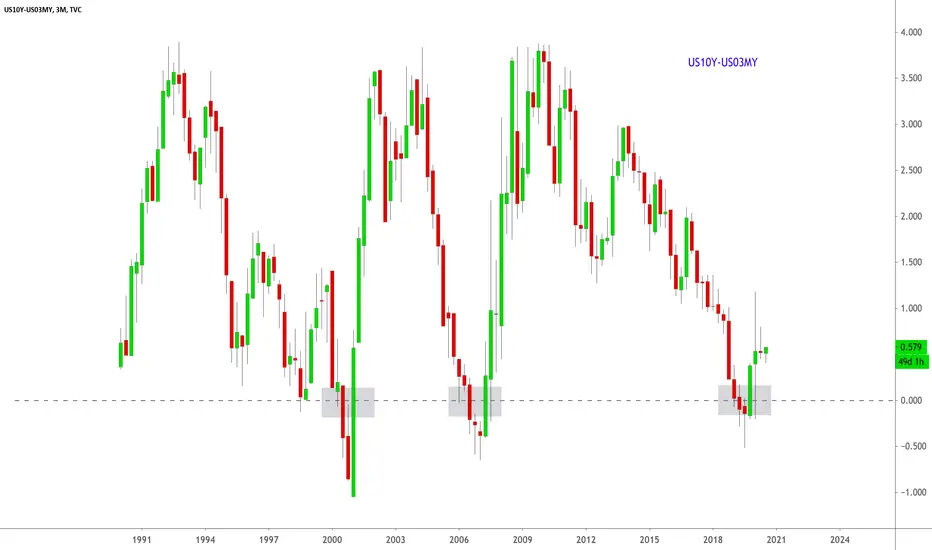
This was the first chart that signaled a recession in April of 2020 when the curve first inverted last year in May. This was pure luck, by simply drawing a fractal of previous yield curve inversions from past recessions from May, which was around 360 days from the TA that suggested the market would recess in April of 2020. Obviously covid is a black-swan--unpredictable and un-speculative--however the bond markets continue to get this all correct, 6-12 months in advance.
Keep your tabs on the curve.
Keep your tabs on the curve.

Publikasi terkait
Pernyataan Penyangkalan
Informasi dan publikasi ini tidak dimaksudkan, dan bukan merupakan, saran atau rekomendasi keuangan, investasi, trading, atau jenis lainnya yang diberikan atau didukung oleh TradingView. Baca selengkapnya di Ketentuan Penggunaan.
Pernyataan Penyangkalan
Informasi dan publikasi ini tidak dimaksudkan, dan bukan merupakan, saran atau rekomendasi keuangan, investasi, trading, atau jenis lainnya yang diberikan atau didukung oleh TradingView. Baca selengkapnya di Ketentuan Penggunaan.