Penjualan
US30: Price Forms a Rising Wedge Pattern
-INTRODUCTION-
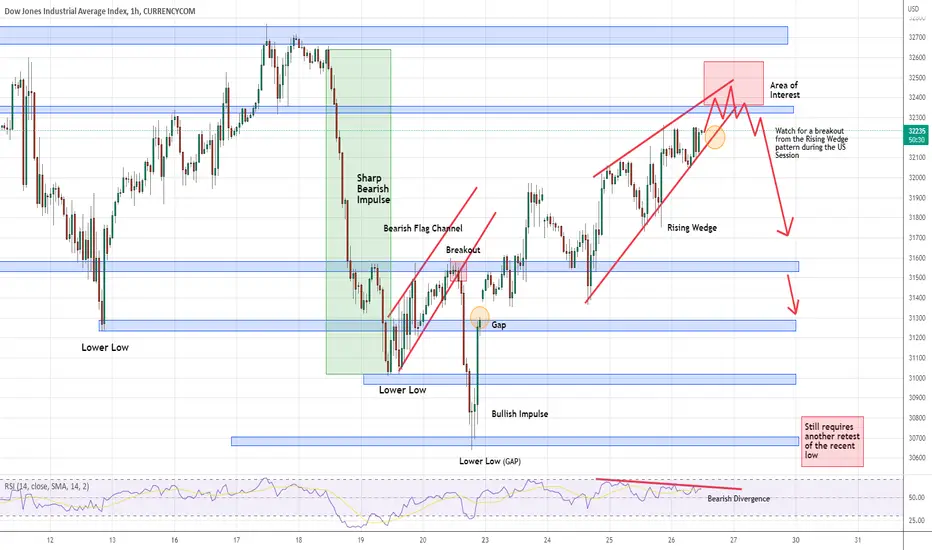
US30 currently has two gaps which are not filled. One is the recent low at the $30650 level while another one is at the $31300 level. In 1-hour chart, we can see that the price has formed a rising wedge pattern, along with a bearish divergence in RSI. Therefore, we expect a sharp bearish breakout sometimes very soon, similar to the last retracement breakout.
-TRADING PLAN-
We will carefully monitor the price movement during the US session today to see whether the price will break the rising wedge pattern.
We love to trade rising/falling wedge patterns. Breaking the pattern often creates a strong price impulse, especially when the pattern is formed as a retracement. Check out our recent retracement trading ideas below :)
US30 currently has two gaps which are not filled. One is the recent low at the $30650 level while another one is at the $31300 level. In 1-hour chart, we can see that the price has formed a rising wedge pattern, along with a bearish divergence in RSI. Therefore, we expect a sharp bearish breakout sometimes very soon, similar to the last retracement breakout.
-TRADING PLAN-
We will carefully monitor the price movement during the US session today to see whether the price will break the rising wedge pattern.
We love to trade rising/falling wedge patterns. Breaking the pattern often creates a strong price impulse, especially when the pattern is formed as a retracement. Check out our recent retracement trading ideas below :)

Publikasi terkait
Pernyataan Penyangkalan
Informasi dan publikasi ini tidak dimaksudkan, dan bukan merupakan, saran atau rekomendasi keuangan, investasi, trading, atau jenis lainnya yang diberikan atau didukung oleh TradingView. Baca selengkapnya di Ketentuan Penggunaan.
Publikasi terkait
Pernyataan Penyangkalan
Informasi dan publikasi ini tidak dimaksudkan, dan bukan merupakan, saran atau rekomendasi keuangan, investasi, trading, atau jenis lainnya yang diberikan atau didukung oleh TradingView. Baca selengkapnya di Ketentuan Penggunaan.