

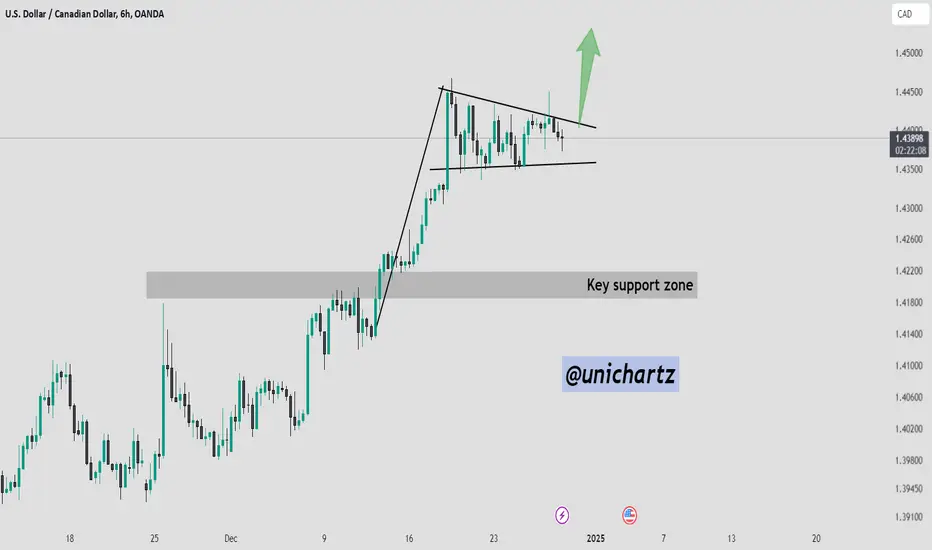
The USD/CAD 6-hour chart shows a bull flag pattern, a continuation setup that typically signals the resumption of the prior bullish trend.
Following a strong upward rally, the price has consolidated in a downward-sloping channel, characteristic of a bull flag.
A breakout above the resistance (~1.4410) would confirm the pattern, potentially driving the price higher toward the next target of 1.4500 or beyond.
Following a strong upward rally, the price has consolidated in a downward-sloping channel, characteristic of a bull flag.
A breakout above the resistance (~1.4410) would confirm the pattern, potentially driving the price higher toward the next target of 1.4500 or beyond.

Daily Free Signals :bit.ly/UnichartzAlpha
Register on Bitunix and trade with me: 👇
bitunix.com/register?vipCode=coEA
Register on Bitunix and trade with me: 👇
bitunix.com/register?vipCode=coEA
Pernyataan Penyangkalan
Informasi dan publikasi ini tidak dimaksudkan, dan bukan merupakan, saran atau rekomendasi keuangan, investasi, trading, atau jenis lainnya yang diberikan atau didukung oleh TradingView. Baca selengkapnya di Ketentuan Penggunaan.
Daily Free Signals :bit.ly/UnichartzAlpha
Register on Bitunix and trade with me: 👇
bitunix.com/register?vipCode=coEA
Register on Bitunix and trade with me: 👇
bitunix.com/register?vipCode=coEA
Pernyataan Penyangkalan
Informasi dan publikasi ini tidak dimaksudkan, dan bukan merupakan, saran atau rekomendasi keuangan, investasi, trading, atau jenis lainnya yang diberikan atau didukung oleh TradingView. Baca selengkapnya di Ketentuan Penggunaan.