

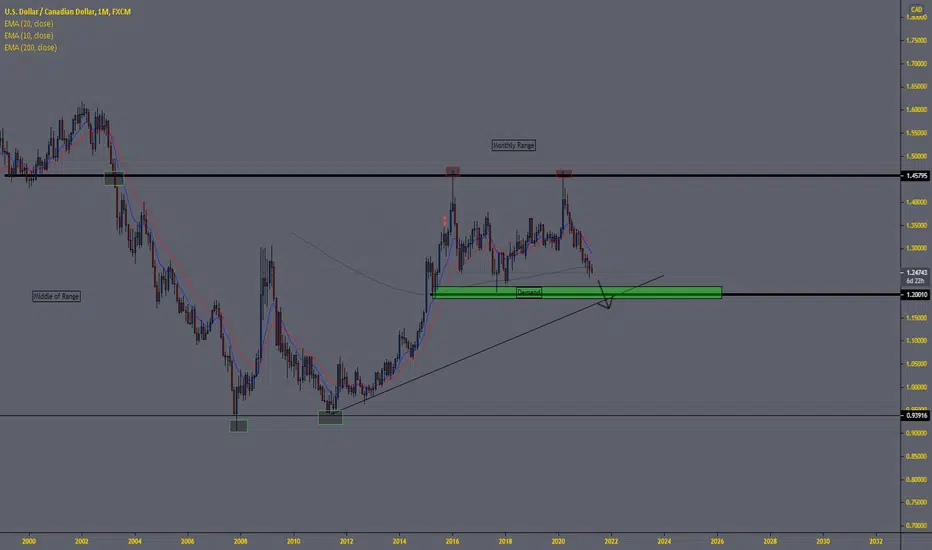
Personally, I am not in this trade. USDCAD looks like it is in a monthly range which is probably the best way to learn how to trade. If weekly/monthly trendline breaks and demand dries up it's safe to say bears may take prices down to 1.06 or lower (from a technical point of view). Look for the negative correlation between oil and the Canadian dollar. I would plot on the daily/weekly. Very rarely I look at the monthly but so far everything looks clean (Daily<-Weekly<-Monthly) in that order. If you take the Fibonacci tool and go from prices 1.44 to 0.93 looks like the 0.50% is confluent with weekly demand.
Catatan
In hindsight, you end up taking a full circle. Stick to the basics, will cause you a lot of time.Catatan
Supposedly interest rates for the dollar will increase (fundamentals). Lets see how this will impact prices candle by candle.Catatan
Looks like the 'DXY' is about to reach the top of the range "12633" which would call for a decline on 'USDCAD' (technically). Demand looks dried up, sellers can now push price lower breaking out of the range causing a compound effect of sellers. Daily and Weekly patterns are slightly conflicting. Only time can candles will tell. Bias - Bearish.
Pernyataan Penyangkalan
Informasi dan publikasi ini tidak dimaksudkan, dan bukan merupakan, saran atau rekomendasi keuangan, investasi, trading, atau jenis lainnya yang diberikan atau didukung oleh TradingView. Baca selengkapnya di Ketentuan Penggunaan.
Pernyataan Penyangkalan
Informasi dan publikasi ini tidak dimaksudkan, dan bukan merupakan, saran atau rekomendasi keuangan, investasi, trading, atau jenis lainnya yang diberikan atau didukung oleh TradingView. Baca selengkapnya di Ketentuan Penggunaan.