

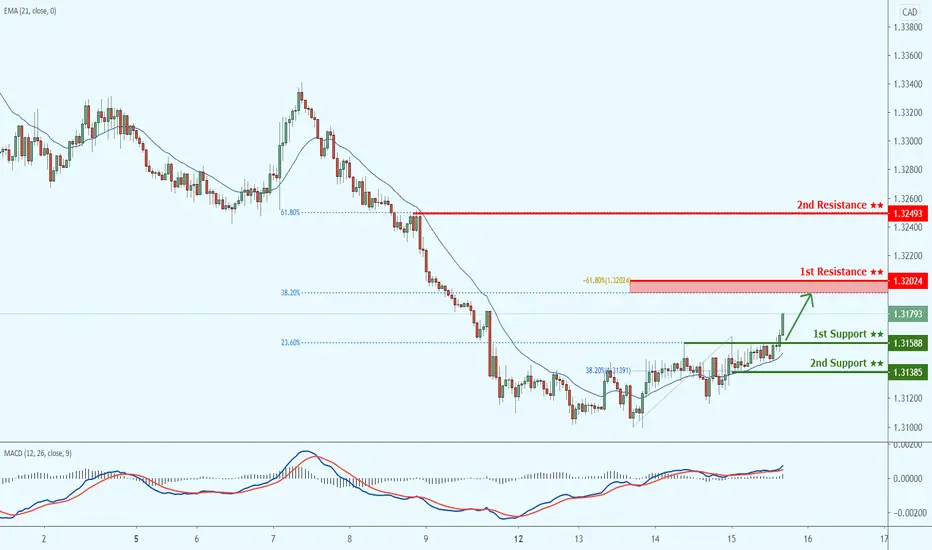
USDCAD is currently bouncing from its 1st support where the 23.6% Fibonacci retracement, and horizontal graphical area. Price could bounce further towards our 1st resistance at at 1.32024 where 38.2% and -61.8% fibonacci retracement area are. The EMA (21) and the MACD are showing bullish pressure for price.

Join Now and Unlock Your Free TradingView Subscription: tickmill.link/3RKXvWm
This analysis is provided as general market commentary and does not constitute investment advice. Past performance is not indicative of future results
This analysis is provided as general market commentary and does not constitute investment advice. Past performance is not indicative of future results
Pernyataan Penyangkalan
Informasi dan publikasi ini tidak dimaksudkan, dan bukan merupakan, saran atau rekomendasi keuangan, investasi, trading, atau jenis lainnya yang diberikan atau didukung oleh TradingView. Baca selengkapnya di Ketentuan Penggunaan.
Join Now and Unlock Your Free TradingView Subscription: tickmill.link/3RKXvWm
This analysis is provided as general market commentary and does not constitute investment advice. Past performance is not indicative of future results
This analysis is provided as general market commentary and does not constitute investment advice. Past performance is not indicative of future results
Pernyataan Penyangkalan
Informasi dan publikasi ini tidak dimaksudkan, dan bukan merupakan, saran atau rekomendasi keuangan, investasi, trading, atau jenis lainnya yang diberikan atau didukung oleh TradingView. Baca selengkapnya di Ketentuan Penggunaan.