

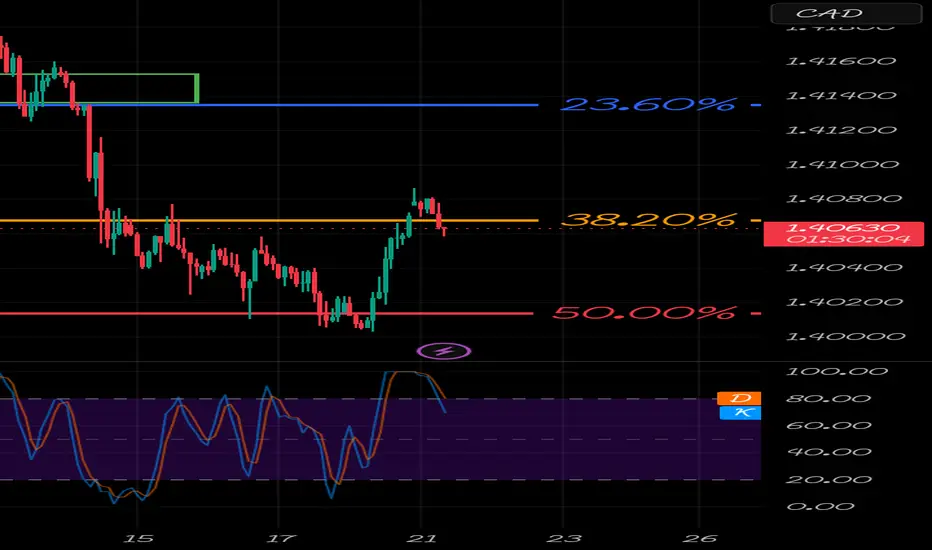
USD/CAD staged its strongest recovery in several sessions after Canadian CPI came in cooler than expected, reducing expectations that the Bank of Canada will need to maintain a restrictive policy stance.
The softer inflation data provided the Canadian dollar with a short-term headwind, allowing USD/CAD to bounce from the 50% Fibonacci retracement toward the 38.2% Fibonacci level.
However, one day's data does not necessarily invalidate the broader bearish trend.
This is where separating macro direction from technical execution becomes critical.
What's Changed Since Yesterday?
Yesterday's key development was the Canadian CPI release.
Lower-than-expected inflation weakened the CAD as traders scaled back expectations for future monetary tightening. That shift was immediately reflected in price action, with USD/CAD recovering sharply from the 50% Fibonacci support.
The question now is whether this is simply a relief rally or the beginning of a larger correction.
Macro Outlook
The broader macro picture has become more balanced.
USD
The U.S. dollar has found some support after last week's heavy selling following softer U.S. CPI and PPI data. However, markets still expect the Federal Reserve to remain cautious, limiting the scope for an aggressive USD recovery.
CAD
Canadian employment remains fundamentally strong, but yesterday's softer inflation report has introduced fresh uncertainty. If inflation continues to cool, expectations for future Bank of Canada tightening could weaken further, reducing one of the CAD's recent advantages.
This creates a market where employment data supports CAD, while inflation data has temporarily shifted momentum back toward USD.
Technical Analysis
The technical structure remains the most important guide.
Current observations:
Price successfully bounced from the 50% Fibonacci retracement.
Buyers have pushed the market back toward the 38.2% Fibonacci level.
The 38.2% retracement is now acting as the first major resistance.
Stochastic RSI is rolling over from overbought territory, suggesting bullish momentum may be fading.
This area will likely determine the next directional move.
Bullish Scenario
If buyers break and close above the 38.2% Fibonacci level, the correction could extend toward:
Former support around 1.4140–1.4150
The broken ascending channel
Bearish Scenario
If sellers defend the 38.2% retracement, the broader downtrend remains intact.
A rejection here would increase the probability of another move toward:
50% Fibonacci
61.8% Fibonacci
Major demand around 1.3900
Trading Advantage™ Framework
USD/CAD Macro Score™ (UMS)
34/100 🔴
The score has improved slightly due to weaker Canadian inflation, but it remains below neutral because:
Canadian employment is still resilient.
The broader technical trend remains bearish.
USD has not yet regained strong macro momentum.
Market Risk Meter™ (MRM)
🟡 MODERATE
Markets are beginning to reassess expectations after Canada's inflation surprise. Volatility could increase as traders decide whether yesterday's move represents a temporary correction or a genuine shift in trend.
My Trading Plan
I'm not interested in buying simply because price has bounced.
Instead, I'm watching how the market behaves around the 38.2% Fibonacci resistance.
If price is rejected here, it would reinforce the broader bearish thesis and present a higher-probability continuation setup.
If buyers establish acceptance above this level, I'll reassess the possibility of a deeper retracement.
For now, price is testing resistance—not confirming a reversal.
Trading Lesson™
One economic report can change short-term momentum, but rarely changes the entire market structure.
Professional traders don't react to every headline—they evaluate whether the new information is strong enough to invalidate their existing thesis.
So far, Canada's softer CPI explains the bounce, but it has not yet invalidated the broader bearish structure.
The Trading Advantage™
"Fundamentals determine the direction. Technical analysis determines the entry and exit. The edge comes from knowing the difference."
The softer inflation data provided the Canadian dollar with a short-term headwind, allowing USD/CAD to bounce from the 50% Fibonacci retracement toward the 38.2% Fibonacci level.
However, one day's data does not necessarily invalidate the broader bearish trend.
This is where separating macro direction from technical execution becomes critical.
What's Changed Since Yesterday?
Yesterday's key development was the Canadian CPI release.
Lower-than-expected inflation weakened the CAD as traders scaled back expectations for future monetary tightening. That shift was immediately reflected in price action, with USD/CAD recovering sharply from the 50% Fibonacci support.
The question now is whether this is simply a relief rally or the beginning of a larger correction.
Macro Outlook
The broader macro picture has become more balanced.
USD
The U.S. dollar has found some support after last week's heavy selling following softer U.S. CPI and PPI data. However, markets still expect the Federal Reserve to remain cautious, limiting the scope for an aggressive USD recovery.
CAD
Canadian employment remains fundamentally strong, but yesterday's softer inflation report has introduced fresh uncertainty. If inflation continues to cool, expectations for future Bank of Canada tightening could weaken further, reducing one of the CAD's recent advantages.
This creates a market where employment data supports CAD, while inflation data has temporarily shifted momentum back toward USD.
Technical Analysis
The technical structure remains the most important guide.
Current observations:
Price successfully bounced from the 50% Fibonacci retracement.
Buyers have pushed the market back toward the 38.2% Fibonacci level.
The 38.2% retracement is now acting as the first major resistance.
Stochastic RSI is rolling over from overbought territory, suggesting bullish momentum may be fading.
This area will likely determine the next directional move.
Bullish Scenario
If buyers break and close above the 38.2% Fibonacci level, the correction could extend toward:
Former support around 1.4140–1.4150
The broken ascending channel
Bearish Scenario
If sellers defend the 38.2% retracement, the broader downtrend remains intact.
A rejection here would increase the probability of another move toward:
50% Fibonacci
61.8% Fibonacci
Major demand around 1.3900
Trading Advantage™ Framework
USD/CAD Macro Score™ (UMS)
34/100 🔴
The score has improved slightly due to weaker Canadian inflation, but it remains below neutral because:
Canadian employment is still resilient.
The broader technical trend remains bearish.
USD has not yet regained strong macro momentum.
Market Risk Meter™ (MRM)
🟡 MODERATE
Markets are beginning to reassess expectations after Canada's inflation surprise. Volatility could increase as traders decide whether yesterday's move represents a temporary correction or a genuine shift in trend.
My Trading Plan
I'm not interested in buying simply because price has bounced.
Instead, I'm watching how the market behaves around the 38.2% Fibonacci resistance.
If price is rejected here, it would reinforce the broader bearish thesis and present a higher-probability continuation setup.
If buyers establish acceptance above this level, I'll reassess the possibility of a deeper retracement.
For now, price is testing resistance—not confirming a reversal.
Trading Lesson™
One economic report can change short-term momentum, but rarely changes the entire market structure.
Professional traders don't react to every headline—they evaluate whether the new information is strong enough to invalidate their existing thesis.
So far, Canada's softer CPI explains the bounce, but it has not yet invalidated the broader bearish structure.
The Trading Advantage™
"Fundamentals determine the direction. Technical analysis determines the entry and exit. The edge comes from knowing the difference."

Pernyataan Penyangkalan
Informasi dan publikasi ini tidak dimaksudkan, dan bukan merupakan, saran atau rekomendasi keuangan, investasi, trading, atau jenis lainnya yang diberikan atau didukung oleh TradingView. Baca selengkapnya di Ketentuan Penggunaan.
Pernyataan Penyangkalan
Informasi dan publikasi ini tidak dimaksudkan, dan bukan merupakan, saran atau rekomendasi keuangan, investasi, trading, atau jenis lainnya yang diberikan atau didukung oleh TradingView. Baca selengkapnya di Ketentuan Penggunaan.