

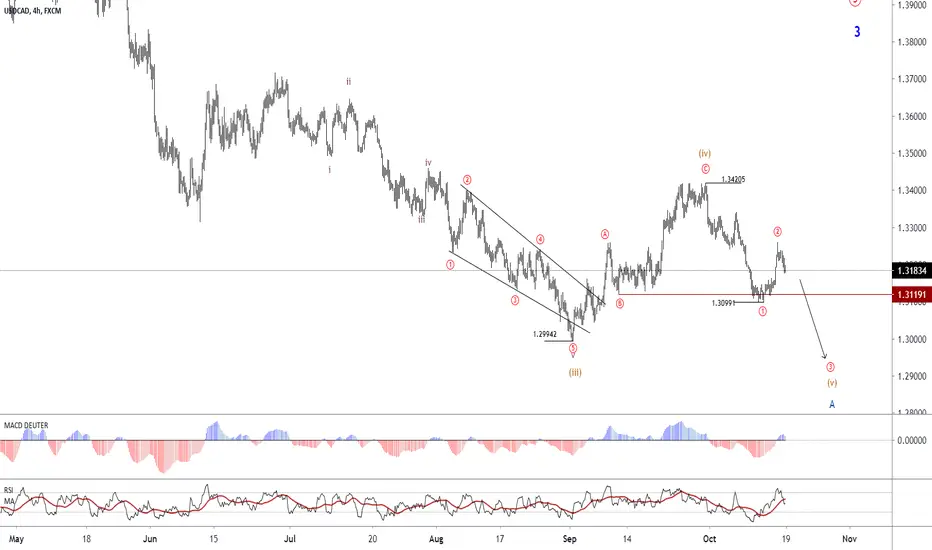
By the price crossing the 1.3099 range, the uptrend encountered some changes, which can be seen in the daily chart.
The overall structure is in the form of a Double Zigzag pattern (in the daily chart) and in the 240-minute chart, the price is completing the V wave from the point of A, which can be extended up to the targets of 1.2950. And in continuation, we enter the corrective (uptrend) to accomplish wave B.
The overall structure is in the form of a Double Zigzag pattern (in the daily chart) and in the 240-minute chart, the price is completing the V wave from the point of A, which can be extended up to the targets of 1.2950. And in continuation, we enter the corrective (uptrend) to accomplish wave B.

Pernyataan Penyangkalan
Informasi dan publikasi ini tidak dimaksudkan, dan bukan merupakan, saran atau rekomendasi keuangan, investasi, trading, atau jenis lainnya yang diberikan atau didukung oleh TradingView. Baca selengkapnya di Ketentuan Penggunaan.
Pernyataan Penyangkalan
Informasi dan publikasi ini tidak dimaksudkan, dan bukan merupakan, saran atau rekomendasi keuangan, investasi, trading, atau jenis lainnya yang diberikan atau didukung oleh TradingView. Baca selengkapnya di Ketentuan Penggunaan.