

Hi guys,
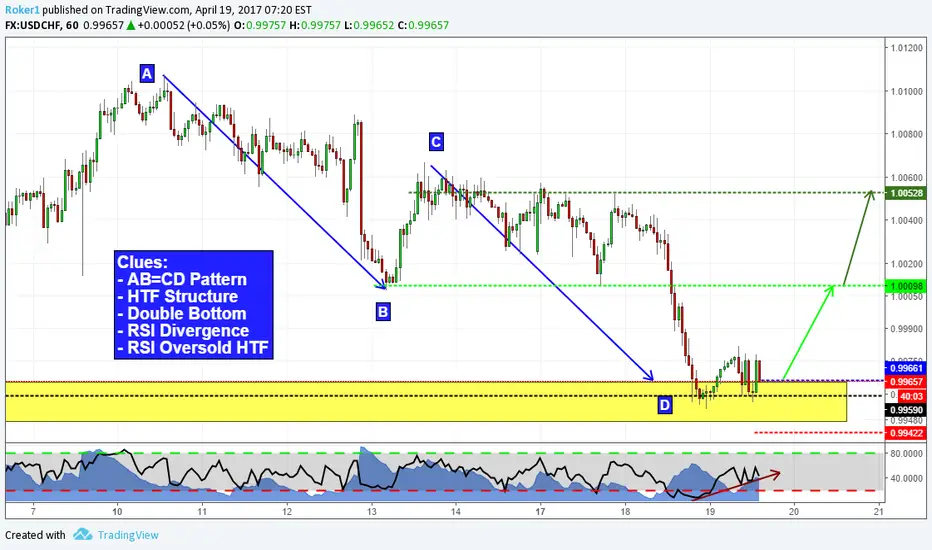
this is the hourly chart on USDCHF. I'm interested in buying this cross and i'll briefly explain why: first of all, price is testing a key structure level that proved to be strong in the recent past. Then at this level also happens to be the completion point of an AB=CD pattern.
In the 4H timeframe RSI is in oversold condition (additional clue).
Here you can see price is founding some troubles breaking through this level, and it has actually formed a nice double bottom with RSI divergence.
Stops below the low, targets as illustrated above.
If you have any question or if you want to share your view, feel free to comment below.
Otherwise, see you in the next chart!

Pernyataan Penyangkalan
Informasi dan publikasi ini tidak dimaksudkan, dan bukan merupakan, saran atau rekomendasi keuangan, investasi, trading, atau jenis lainnya yang diberikan atau didukung oleh TradingView. Baca selengkapnya di Ketentuan Penggunaan.
Pernyataan Penyangkalan
Informasi dan publikasi ini tidak dimaksudkan, dan bukan merupakan, saran atau rekomendasi keuangan, investasi, trading, atau jenis lainnya yang diberikan atau didukung oleh TradingView. Baca selengkapnya di Ketentuan Penggunaan.