

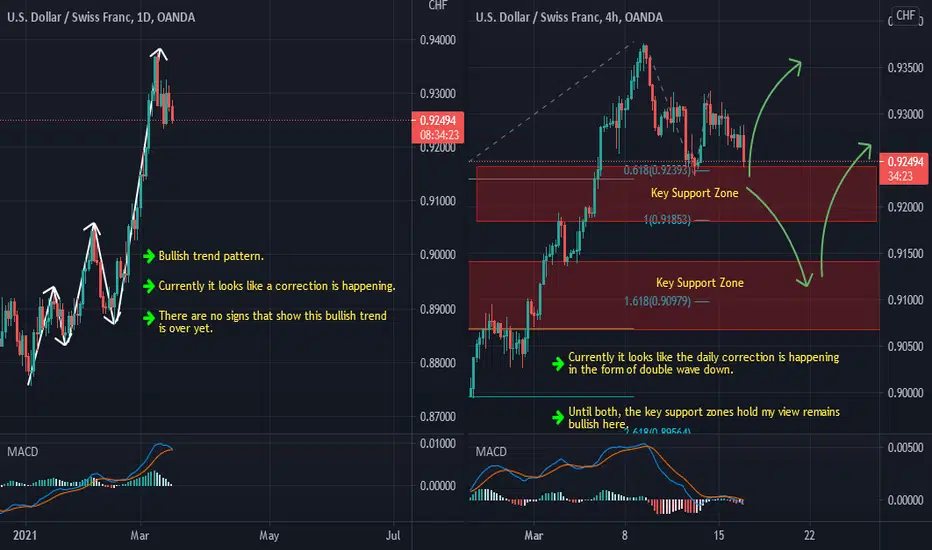
D1 - Bullish trend pattern. Currently, it looks like a correction is happening.
There are no signs that show this bullish trend is over yet.
H4 - Currently it looks like the daily correction is happening in the form of double wave down.
We have two key support zones that have formed. The first zone is formed by the 61.8%, 100% Fibonacci expansion levels of the first wave and the 23.8% Fibonacci retracement level of the daily bullish trend pattern.
The second zone is formed by the 161.8% Fibonacci expansion level of the first wave and the 38.2% - 50% Fibonacci retracement levels of the daily bullish trend pattern.
Until both, the key support zones hold my view remains bullish here.
There are no signs that show this bullish trend is over yet.
H4 - Currently it looks like the daily correction is happening in the form of double wave down.
We have two key support zones that have formed. The first zone is formed by the 61.8%, 100% Fibonacci expansion levels of the first wave and the 23.8% Fibonacci retracement level of the daily bullish trend pattern.
The second zone is formed by the 161.8% Fibonacci expansion level of the first wave and the 38.2% - 50% Fibonacci retracement levels of the daily bullish trend pattern.
Until both, the key support zones hold my view remains bullish here.
Catatan
The price action followed my analysis and moved higher from the first support zone providing a fantastic move to the upside!
Pernyataan Penyangkalan
Informasi dan publikasi ini tidak dimaksudkan, dan bukan merupakan, saran atau rekomendasi keuangan, investasi, trading, atau jenis lainnya yang diberikan atau didukung oleh TradingView. Baca selengkapnya di Ketentuan Penggunaan.
Pernyataan Penyangkalan
Informasi dan publikasi ini tidak dimaksudkan, dan bukan merupakan, saran atau rekomendasi keuangan, investasi, trading, atau jenis lainnya yang diberikan atau didukung oleh TradingView. Baca selengkapnya di Ketentuan Penggunaan.