
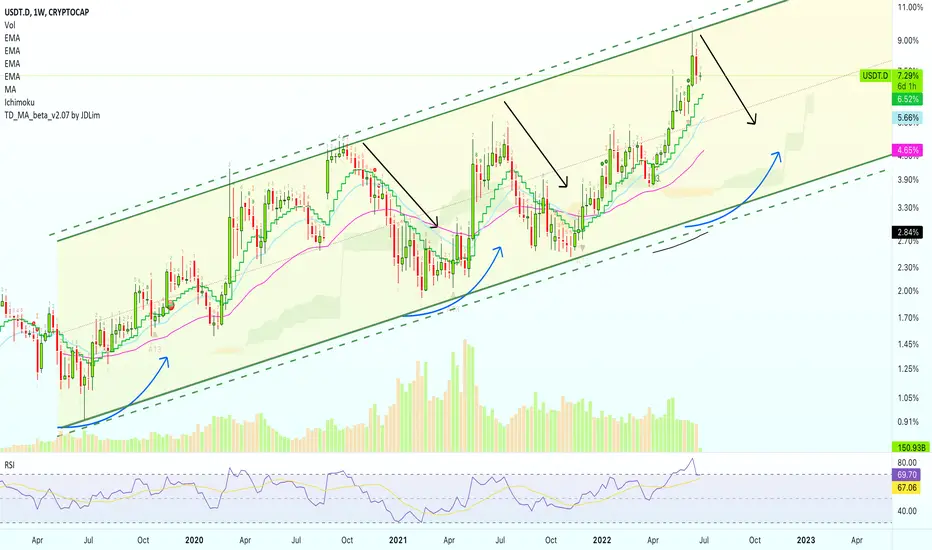
This is the long-term chart for Tether Dominance (USDT.D) and we are looking mainly at an ascending channel.
Each time the upper-band of the channel is hit we get a retrace/correction.
The upper-band being hit coincides with an overbought RSI.
An overbought RSI has always led to a strong correction.
Just yesterday/last week, USDT.D closed with the highest RSI value ever, signaling an overbought status.
It is only a matter of time before Bitcoin starts to grow; big, fast & strong.
I meant to say, it is only a matter of time before Tether Dominances drops.
Namaste.
Each time the upper-band of the channel is hit we get a retrace/correction.
The upper-band being hit coincides with an overbought RSI.
An overbought RSI has always led to a strong correction.
Just yesterday/last week, USDT.D closed with the highest RSI value ever, signaling an overbought status.
It is only a matter of time before Bitcoin starts to grow; big, fast & strong.
I meant to say, it is only a matter of time before Tether Dominances drops.
Namaste.

💯 Trading signals (results)
— Late 2026👇
t.me/masteranandatrades/9279
🔥 10-25X Leverage
—Trade-numbers:
t.me/masteranandatrades/9271
✅ PREMIUM &Content
—One-Time Payment
t.me/lamatrades/4 (🔝 since 2017)
— Late 2026👇
t.me/masteranandatrades/9279
🔥 10-25X Leverage
—Trade-numbers:
t.me/masteranandatrades/9271
✅ PREMIUM &Content
—One-Time Payment
t.me/lamatrades/4 (🔝 since 2017)
Publikasi terkait
Pernyataan Penyangkalan
Informasi dan publikasi ini tidak dimaksudkan, dan bukan merupakan, saran atau rekomendasi keuangan, investasi, trading, atau jenis lainnya yang diberikan atau didukung oleh TradingView. Baca selengkapnya di Ketentuan Penggunaan.
💯 Trading signals (results)
— Late 2026👇
t.me/masteranandatrades/9279
🔥 10-25X Leverage
—Trade-numbers:
t.me/masteranandatrades/9271
✅ PREMIUM &Content
—One-Time Payment
t.me/lamatrades/4 (🔝 since 2017)
— Late 2026👇
t.me/masteranandatrades/9279
🔥 10-25X Leverage
—Trade-numbers:
t.me/masteranandatrades/9271
✅ PREMIUM &Content
—One-Time Payment
t.me/lamatrades/4 (🔝 since 2017)
Publikasi terkait
Pernyataan Penyangkalan
Informasi dan publikasi ini tidak dimaksudkan, dan bukan merupakan, saran atau rekomendasi keuangan, investasi, trading, atau jenis lainnya yang diberikan atau didukung oleh TradingView. Baca selengkapnya di Ketentuan Penggunaan.