
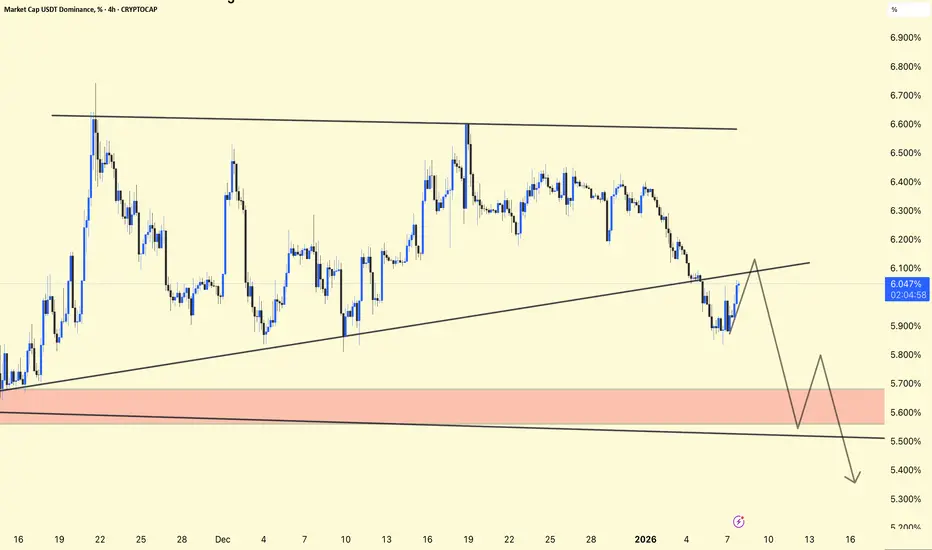
USDT Dominance – Chart Update
USDT.D is currently holding an ascending trendline support
A short-term bounce or pullback is possible from this area
Overall structure still shows a bearish bias
Resistance: 6.10% – 6.20%
Major Support / Demand Zone: 5.60% – 5.55%
Rejection from 6.10–6.20% → Positive for altcoins
Break and hold above resistance → Market may turn risk-off short term
USDT Dominance is gradually showing downside pressure.
A clean breakdown below 5.60% could signal a strong altcoin rally.
For educational purposes only. Not financial advice.

Publikasi terkait
Pernyataan Penyangkalan
Informasi dan publikasi ini tidak dimaksudkan, dan bukan merupakan, saran atau rekomendasi keuangan, investasi, trading, atau jenis lainnya yang diberikan atau didukung oleh TradingView. Baca selengkapnya di Ketentuan Penggunaan.
Publikasi terkait
Pernyataan Penyangkalan
Informasi dan publikasi ini tidak dimaksudkan, dan bukan merupakan, saran atau rekomendasi keuangan, investasi, trading, atau jenis lainnya yang diberikan atau didukung oleh TradingView. Baca selengkapnya di Ketentuan Penggunaan.