
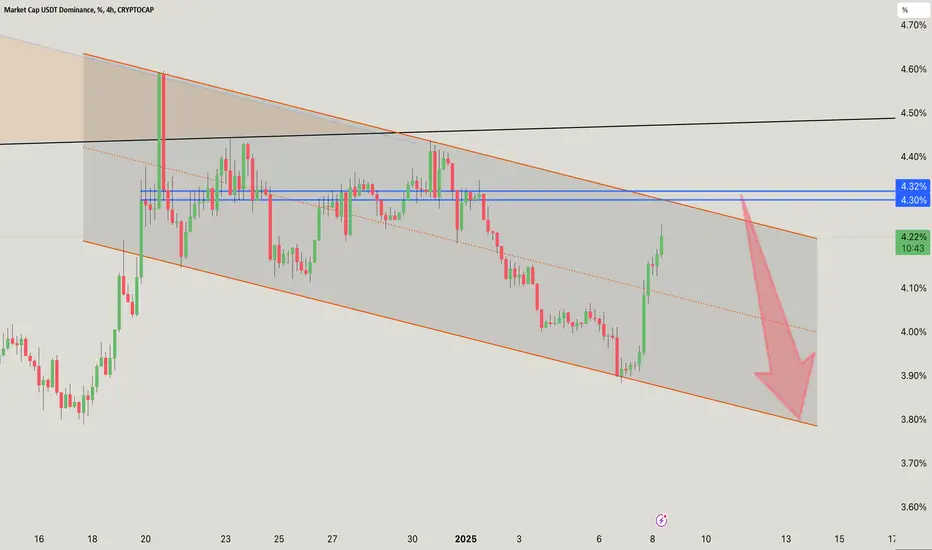
USDT.DOMINANCE CHART UPDATE!
Descending Channel: Dominance is trading within a well-defined descending channel, indicating a controlled downtrend.
Resistance Zone: It is currently approaching the upper boundary of the channel and a horizontal resistance zone near 4.30%-4.32%. This confluence zone could act as a rejection point.
Potential Downside: Failure to break this resistance zone could lead to a downward move toward the lower boundary of the channel, around 3.80%-3.90%.
Bearish Bias: Dominance remains under bearish pressure as long as it remains within the descending channel.
If there is a breakout above 4.32%, it could temporarily turn the sentiment bullish, indicating a reversal or a temporary halt to upward momentum.
Let me know if you’d like further assistance or adjustments!
DYOR. NFA

Publikasi terkait
Pernyataan Penyangkalan
Informasi dan publikasi ini tidak dimaksudkan, dan bukan merupakan, saran atau rekomendasi keuangan, investasi, trading, atau jenis lainnya yang diberikan atau didukung oleh TradingView. Baca selengkapnya di Ketentuan Penggunaan.
Publikasi terkait
Pernyataan Penyangkalan
Informasi dan publikasi ini tidak dimaksudkan, dan bukan merupakan, saran atau rekomendasi keuangan, investasi, trading, atau jenis lainnya yang diberikan atau didukung oleh TradingView. Baca selengkapnya di Ketentuan Penggunaan.