
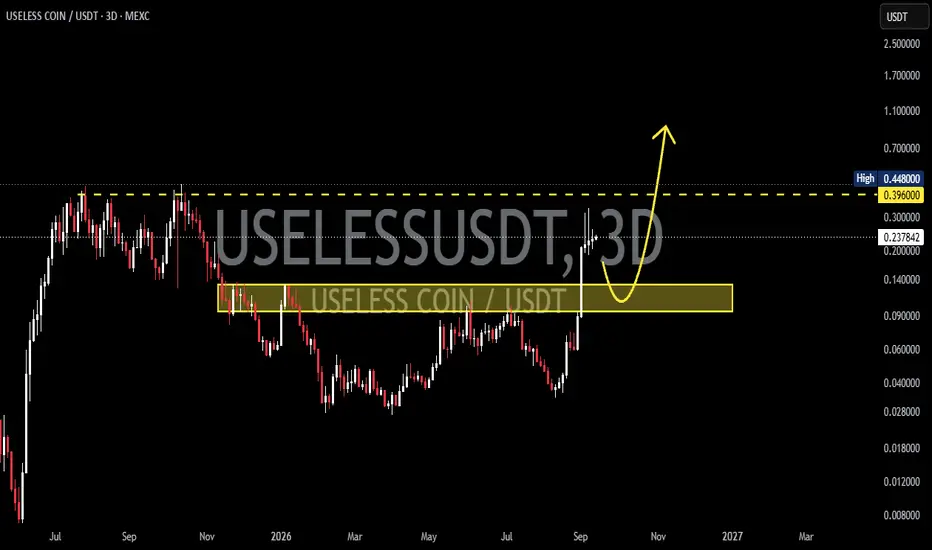
The  USELESS chart shows an interesting structural shift after a prolonged consolidation/accumulation phase from late 2025 through mid-2026. Price subsequently moved higher and broke out of the previous resistance/structure, making the yellow zone an important area for testing the validity of that breakout.
🟨 Key Support / Retest Zone: $0.099 – $0.132
🔴 Major Resistance: $0.396
🔵 Previous High: $0.448
📍 Current Price: around $0.2387
---
🧩 Pattern & Market Structure
🔄 Broad Accumulation / Re-Accumulation Structure
Price previously experienced a prolonged decline from the $0.40+ area and then formed a base/accumulation phase, with multiple rejections around the lower area.
Over time, the structure began to show:
📉 Selling pressure gradually weakened
➡️ Price formed a more stable base
📈 Higher Lows began to develop
🚀 Price then broke through the $0.099–$0.132 area
🔄 The breakout area now has the potential to turn into support
This makes the current structure interesting as a breakout → retest → continuation setup.
---
🟨 SUPPORT RETEST — $0.099–$0.132
The yellow zone is the most important part of this setup.
After the breakout, price has already moved significantly above this zone. Technically, a retest of the breakout/support area can be a normal process before the next bullish continuation.
🎯 Primary Expectation:
Price retraces toward $0.132–$0.099, then searches for rejection/buyer reaction before moving higher again.
💡 As long as price is able to hold this zone as support, the previous breakout still has the potential to develop into a continuation move.
---
🟢 BULLISH SCENARIO — Retest & Continuation
🚀 Bullish Case
IfUSELESS corrects into the $0.099–$0.132 zone and then forms a bullish rejection with buyers regaining control:
🟨 $0.099–$0.132 → Support Retest
📈 Buyers defend the zone
🔄 Price forms a Higher Low
🚀 Bullish momentum increases again
🎯 Price could potentially test $0.396
🔥 If $0.396 is successfully broken → potential retest of $0.448
🚀 A breakout above $0.448 could open the way toward higher psychological price areas.
In this type of structure, a successful retest can actually confirm that the previous resistance has turned into support.
---
🔴 BEARISH SCENARIO — Failed Breakout
⚠️ The bearish scenario needs attention if the retest fails to produce a bullish reaction.
If price enters the $0.099–$0.132 zone and breaks down:
📉 Support begins to lose strength
🔻 Price fails to reclaim $0.132
⚠️ Selling pressure increases
❌ A strong breakdown below $0.099 would be an important invalidation of the bullish setup.
If $0.099 definitively loses support on the 3D timeframe, the previous breakout could become a failed breakout, and price may return to search for lower support/liquidity.
---
🎯 KEY LEVELS TO WATCH
🟨 $0.099 – $0.132 → Major Retest / Support Zone
📈 $0.2387 → Current Price Area
🔴 $0.396 → Major Resistance
🔵 $0.448 → Previous High / Breakout Level
🚀 $0.70–$1.00+ → Higher-price expansion area if the major resistance breakout gains strong momentum
---
🧠 MARKET OUTLOOK
Overall, the 3D structure ofUSELESS remains interesting as long as price can hold $0.099–$0.132.
📌 The most interesting setup is not chasing price after the rally, but waiting to see whether price retests the yellow block and how buyers react within that zone.
🟢 Bullish: Retest $0.099–$0.132 → Rejection → Continuation → $0.396 → $0.448 → Potential Expansion Higher.
🔴 Bearish: Breakdown below $0.099 → Bullish breakout structure weakens/invalidates → Potential Search for Lower Support.
🔥 Key Idea:
“Breakout is only the first step. The real confirmation comes from how price reacts when it retests the breakout zone.”
#USELESS #USELESSCOIN #Crypto
USELESS chart shows an interesting structural shift after a prolonged consolidation/accumulation phase from late 2025 through mid-2026. Price subsequently moved higher and broke out of the previous resistance/structure, making the yellow zone an important area for testing the validity of that breakout.🟨 Key Support / Retest Zone: $0.099 – $0.132
🔴 Major Resistance: $0.396
🔵 Previous High: $0.448
📍 Current Price: around $0.2387
---
🧩 Pattern & Market Structure
🔄 Broad Accumulation / Re-Accumulation Structure
Price previously experienced a prolonged decline from the $0.40+ area and then formed a base/accumulation phase, with multiple rejections around the lower area.
Over time, the structure began to show:
📉 Selling pressure gradually weakened
➡️ Price formed a more stable base
📈 Higher Lows began to develop
🚀 Price then broke through the $0.099–$0.132 area
🔄 The breakout area now has the potential to turn into support
This makes the current structure interesting as a breakout → retest → continuation setup.
---
🟨 SUPPORT RETEST — $0.099–$0.132
The yellow zone is the most important part of this setup.
After the breakout, price has already moved significantly above this zone. Technically, a retest of the breakout/support area can be a normal process before the next bullish continuation.
🎯 Primary Expectation:
Price retraces toward $0.132–$0.099, then searches for rejection/buyer reaction before moving higher again.
💡 As long as price is able to hold this zone as support, the previous breakout still has the potential to develop into a continuation move.
---
🟢 BULLISH SCENARIO — Retest & Continuation
🚀 Bullish Case
If
USELESS corrects into the $0.099–$0.132 zone and then forms a bullish rejection with buyers regaining control:🟨 $0.099–$0.132 → Support Retest
📈 Buyers defend the zone
🔄 Price forms a Higher Low
🚀 Bullish momentum increases again
🎯 Price could potentially test $0.396
🔥 If $0.396 is successfully broken → potential retest of $0.448
🚀 A breakout above $0.448 could open the way toward higher psychological price areas.
In this type of structure, a successful retest can actually confirm that the previous resistance has turned into support.
---
🔴 BEARISH SCENARIO — Failed Breakout
⚠️ The bearish scenario needs attention if the retest fails to produce a bullish reaction.
If price enters the $0.099–$0.132 zone and breaks down:
📉 Support begins to lose strength
🔻 Price fails to reclaim $0.132
⚠️ Selling pressure increases
❌ A strong breakdown below $0.099 would be an important invalidation of the bullish setup.
If $0.099 definitively loses support on the 3D timeframe, the previous breakout could become a failed breakout, and price may return to search for lower support/liquidity.
---
🎯 KEY LEVELS TO WATCH
🟨 $0.099 – $0.132 → Major Retest / Support Zone
📈 $0.2387 → Current Price Area
🔴 $0.396 → Major Resistance
🔵 $0.448 → Previous High / Breakout Level
🚀 $0.70–$1.00+ → Higher-price expansion area if the major resistance breakout gains strong momentum
---
🧠 MARKET OUTLOOK
Overall, the 3D structure of
USELESS remains interesting as long as price can hold $0.099–$0.132.📌 The most interesting setup is not chasing price after the rally, but waiting to see whether price retests the yellow block and how buyers react within that zone.
🟢 Bullish: Retest $0.099–$0.132 → Rejection → Continuation → $0.396 → $0.448 → Potential Expansion Higher.
🔴 Bearish: Breakdown below $0.099 → Bullish breakout structure weakens/invalidates → Potential Search for Lower Support.
🔥 Key Idea:
“Breakout is only the first step. The real confirmation comes from how price reacts when it retests the breakout zone.”
#USELESS #USELESSCOIN #Crypto

✅ Get Free Signals! Join Our Telegram Channel Here: t.me/TheCryptoNuclear
✅ Twitter: twitter.com/crypto_nuclear
✅ Join Bybit : partner.bybit.com/b/nuclearvip
✅ Benefits : Lifetime Trading Fee Discount -50%
✅ Twitter: twitter.com/crypto_nuclear
✅ Join Bybit : partner.bybit.com/b/nuclearvip
✅ Benefits : Lifetime Trading Fee Discount -50%
Pernyataan Penyangkalan
Informasi dan publikasi ini tidak dimaksudkan, dan bukan merupakan, saran atau rekomendasi keuangan, investasi, trading, atau jenis lainnya yang diberikan atau didukung oleh TradingView. Baca selengkapnya di Ketentuan Penggunaan.
✅ Get Free Signals! Join Our Telegram Channel Here: t.me/TheCryptoNuclear
✅ Twitter: twitter.com/crypto_nuclear
✅ Join Bybit : partner.bybit.com/b/nuclearvip
✅ Benefits : Lifetime Trading Fee Discount -50%
✅ Twitter: twitter.com/crypto_nuclear
✅ Join Bybit : partner.bybit.com/b/nuclearvip
✅ Benefits : Lifetime Trading Fee Discount -50%
Pernyataan Penyangkalan
Informasi dan publikasi ini tidak dimaksudkan, dan bukan merupakan, saran atau rekomendasi keuangan, investasi, trading, atau jenis lainnya yang diberikan atau didukung oleh TradingView. Baca selengkapnya di Ketentuan Penggunaan.