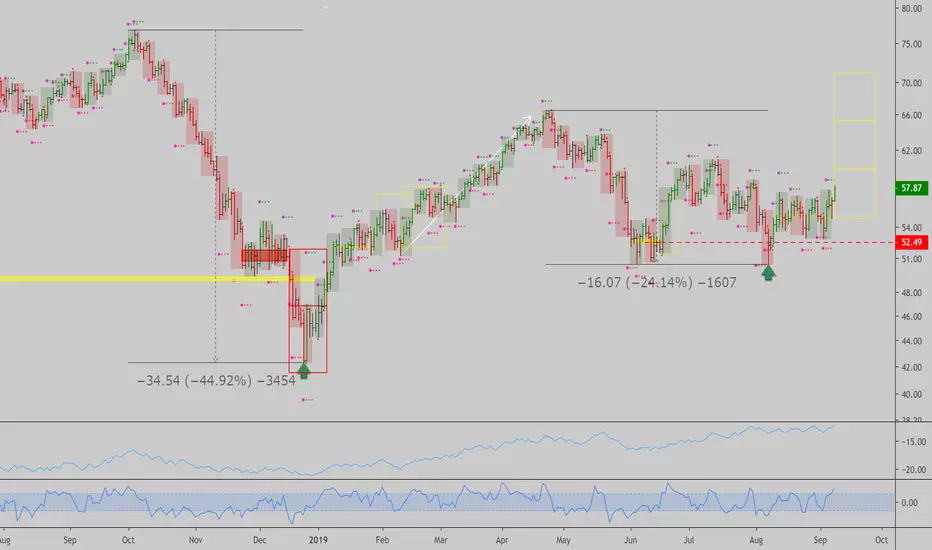
Interesting setup in  USOIL, the fall from the last top favored a bull run in stocks with a 6 month lag, as per timwest's findings suggest (every time oil falls 25-30% it boosts earnings going forward). Monthly charts show accumulation supporting the market below, and daily confirms a trend by today's close. I think stocks are headed higher with oil here as well.
My bias is bullish in energy, oil, chip maker stocks, renewable energy related stocks, and the overall S&P500 index between now and the end of 2020 possibly. Let's see how it goes...Short term stop for oil is below last Friday's low, and short term targets are shown by the yellow boxes on chart.
Cheers,
Ivan Labrie.
USOIL, the fall from the last top favored a bull run in stocks with a 6 month lag, as per timwest's findings suggest (every time oil falls 25-30% it boosts earnings going forward). Monthly charts show accumulation supporting the market below, and daily confirms a trend by today's close. I think stocks are headed higher with oil here as well.My bias is bullish in energy, oil, chip maker stocks, renewable energy related stocks, and the overall S&P500 index between now and the end of 2020 possibly. Let's see how it goes...Short term stop for oil is below last Friday's low, and short term targets are shown by the yellow boxes on chart.
Cheers,
Ivan Labrie.
Catatan
Trading ditutup: stop tercapai
Trade aktif
Catatan
Last entry is in profit: If it holds up from here oil can trend higher.
Trade aktif
Good time to revisit this market on the long side.
Stop @ 52.49
Catatan
On track: Trading ditutup secara manual
Sold in profit here for now, last: 55.95Catatan
Timemode trend signals in #oil show the market is sideways. I graphed the directional moves in green or red depending on direction, and the 'energy dissipation' after a move reaches target or the time duration for the move expires in yellow. You can see how a sideways market behaves, it consolidates and trends in bursts, but stays range bound.The white bars are my guess/forecast based on monthly bars, so far we had a rather similar pattern in it.

Public, timestamped track record. Free month of the desk: ivanlabrie.netlify.app
Publikasi terkait
Pernyataan Penyangkalan
Informasi dan publikasi ini tidak dimaksudkan, dan bukan merupakan, saran atau rekomendasi keuangan, investasi, trading, atau jenis lainnya yang diberikan atau didukung oleh TradingView. Baca selengkapnya di Ketentuan Penggunaan.