
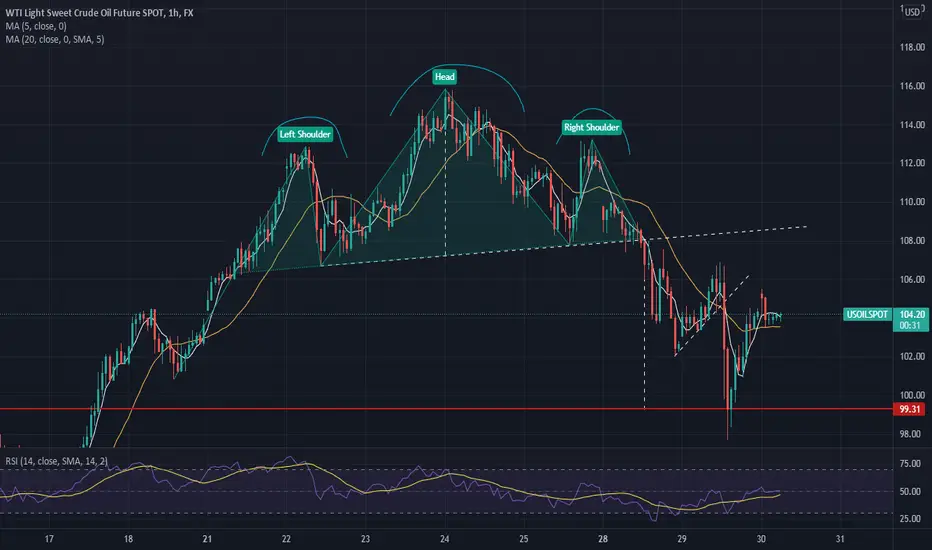
This is an example of a head a shoulder pattern that worked to perfection.
The two shoulders and the head can be distinguished very easily. We can also see a negative divergence with the RSI at the top of the head, which shows declining momentum.
After the break of the neckline, we can see a throwback towards it before the resumption of the down move.
Finally, the minimum target after the break of the neckline was hit. Indeed, to find the price target, we take the distance from the top of the head to the neckline and subtract it from the break of the neckline. Here, the target was 99.31.
The two shoulders and the head can be distinguished very easily. We can also see a negative divergence with the RSI at the top of the head, which shows declining momentum.
After the break of the neckline, we can see a throwback towards it before the resumption of the down move.
Finally, the minimum target after the break of the neckline was hit. Indeed, to find the price target, we take the distance from the top of the head to the neckline and subtract it from the break of the neckline. Here, the target was 99.31.

Pernyataan Penyangkalan
Informasi dan publikasi ini tidak dimaksudkan, dan bukan merupakan, saran atau rekomendasi keuangan, investasi, trading, atau jenis lainnya yang diberikan atau didukung oleh TradingView. Baca selengkapnya di Ketentuan Penggunaan.
Pernyataan Penyangkalan
Informasi dan publikasi ini tidak dimaksudkan, dan bukan merupakan, saran atau rekomendasi keuangan, investasi, trading, atau jenis lainnya yang diberikan atau didukung oleh TradingView. Baca selengkapnya di Ketentuan Penggunaan.