
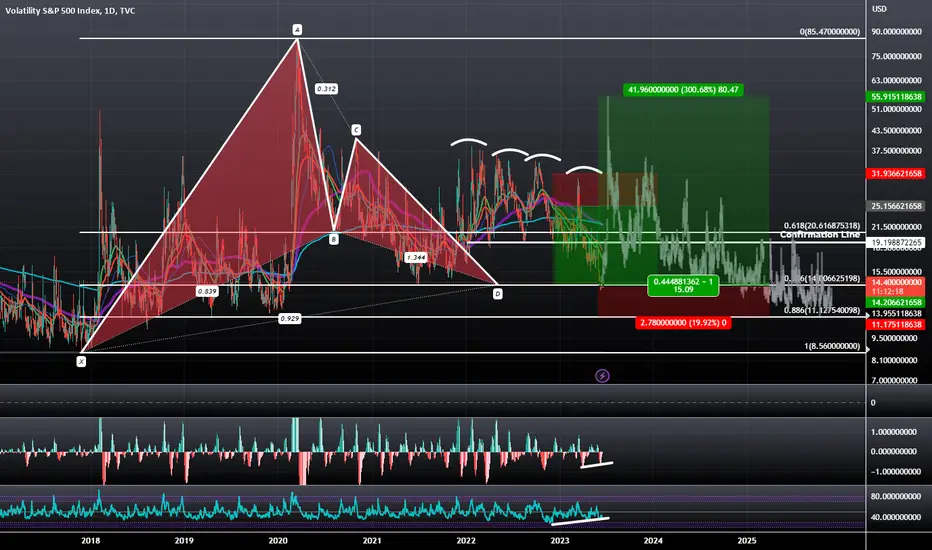
There is a Bullish Gartley visible on the Log Scale chart that is currently giving us a Potential Double Bottom at the 0.786 PCZ with Bullish Divergence on both the RSI and MACD and if it plays out, I think it could spike all the way up to around $55 before coming back down and continuing to the historical lows.
Trade aktif

Publikasi terkait
Pernyataan Penyangkalan
Informasi dan publikasi ini tidak dimaksudkan, dan bukan merupakan, saran atau rekomendasi keuangan, investasi, trading, atau jenis lainnya yang diberikan atau didukung oleh TradingView. Baca selengkapnya di Ketentuan Penggunaan.
Publikasi terkait
Pernyataan Penyangkalan
Informasi dan publikasi ini tidak dimaksudkan, dan bukan merupakan, saran atau rekomendasi keuangan, investasi, trading, atau jenis lainnya yang diberikan atau didukung oleh TradingView. Baca selengkapnya di Ketentuan Penggunaan.