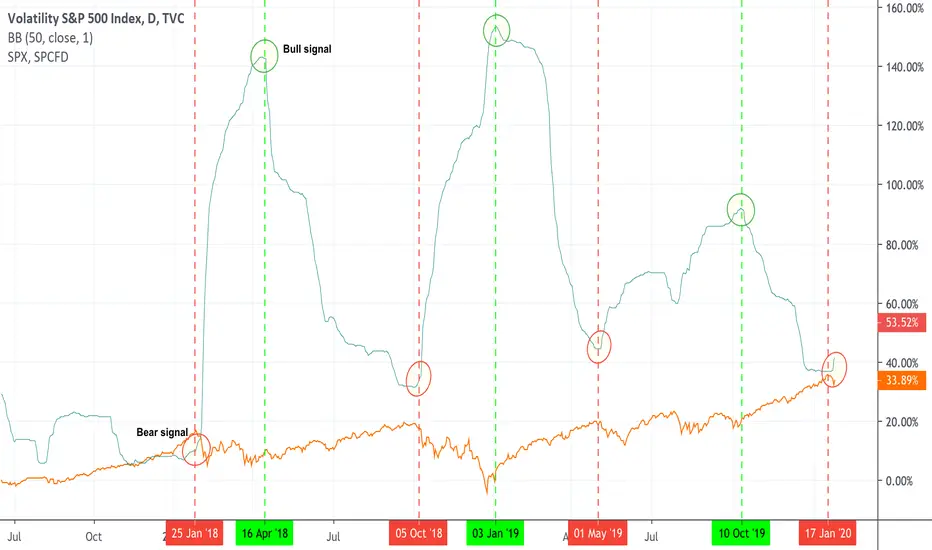
I follow a CFA from Charles Schwab, who uses this signal to establish negative or positive sentiment. To notice how it worked in the past, I have added the S&P500 trend line.
The idea is as follows:
When the upper Bollinger Band (with a 50 period and 1 standard deviation) on the VIX turns higher, that is a bearish sign, and when it turns lower, the SPY tends to rally.
-----------
Also, today January 28th, we had a Hindenburg Omen flash.
The idea is as follows:
When the upper Bollinger Band (with a 50 period and 1 standard deviation) on the
VIX turns higher, that is a bearish sign, and when it turns lower, the SPY tends to rally.-----------
Also, today January 28th, we had a Hindenburg Omen flash.

Pernyataan Penyangkalan
Informasi dan publikasi ini tidak dimaksudkan, dan bukan merupakan, saran atau rekomendasi keuangan, investasi, trading, atau jenis lainnya yang diberikan atau didukung oleh TradingView. Baca selengkapnya di Ketentuan Penggunaan.
Pernyataan Penyangkalan
Informasi dan publikasi ini tidak dimaksudkan, dan bukan merupakan, saran atau rekomendasi keuangan, investasi, trading, atau jenis lainnya yang diberikan atau didukung oleh TradingView. Baca selengkapnya di Ketentuan Penggunaan.