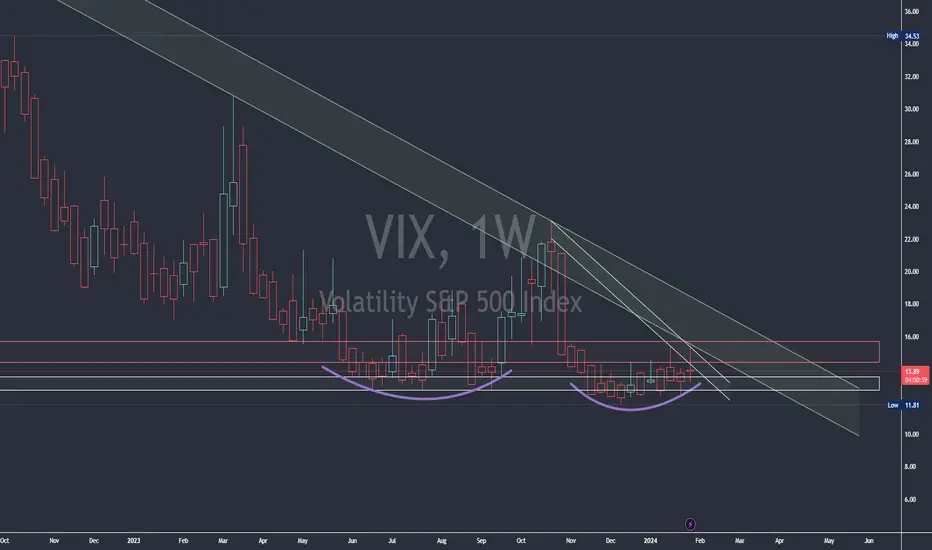
Weekly Chart from COVID Highs

Zoomed-In Weekly Chart

- Weekly Chart has yet to break out the trend line (green bar) from COVID Highs
- The bottom appears to be getting tight and has consolidated sideways for weeks
- June - September 2023 the chart was basing which rallied 10 points in the end of September
- The base in June - Sept was not as tight as the chart is showing now
- This is even with
 SPY continuing to increase but VIX holding it's range (KEY)
 - Weekly chart showing a rounding bottom
Zoomed-In Weekly Chart
- First we would like to see the weekly break the short term white trend line
- To break to the upside into the green downtrend line from COVID Highs we would need VIX weekly to break through and close above $15.75
- High chance if it breaks $15.75 we will hit the top line of the downtrend which the price will depend on when this break will happen
- We could see highs of
 VIX to $17-$18 if breaks $15.75
Catatan
Chart broke out and tapped off of green trend line top. Will see what the end of week plays out to see if its a push or simply what it did prior. Or even a fake breakout
Pernyataan Penyangkalan
Informasi dan publikasi ini tidak dimaksudkan, dan bukan merupakan, saran atau rekomendasi keuangan, investasi, trading, atau jenis lainnya yang diberikan atau didukung oleh TradingView. Baca selengkapnya di Ketentuan Penggunaan.
Pernyataan Penyangkalan
Informasi dan publikasi ini tidak dimaksudkan, dan bukan merupakan, saran atau rekomendasi keuangan, investasi, trading, atau jenis lainnya yang diberikan atau didukung oleh TradingView. Baca selengkapnya di Ketentuan Penggunaan.