Diupdate
VTC Time Bomb
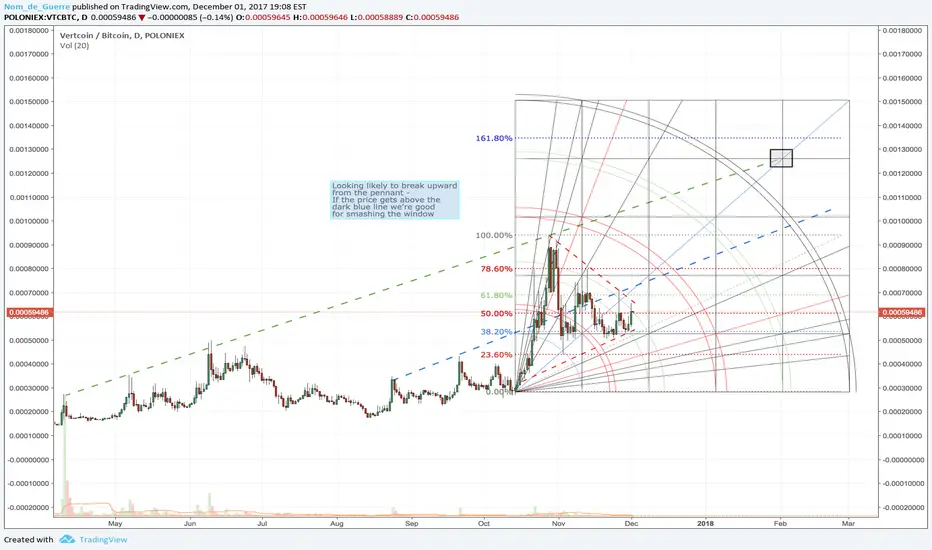
Rally coming when we break out the pennant
Catatan
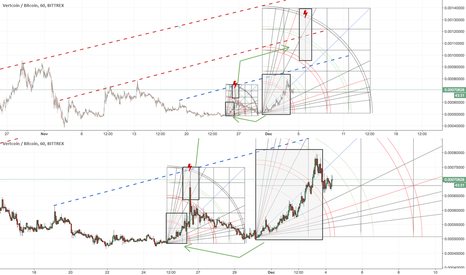
Breakout - Currently stuck beneath ascending resistance - Need to stay above 0.00073 to keep going up this timeCatatan
VTC very bullish signals - Todays new candle has just opened exactly at the intersection of the dotted blue line and the blue Gann 1x1 fib ray - It opened above the lines so this is now on support - New higher maximum long target of 0.00143 is now possible at the 161.80% fib - HOW TO READ A GANN CHART - Resistance is shown by the arcs, you can see how the candles are curved by the arcs, you can see how the breakout occurred when the candle managed to open outside the arc - Once on top of the arc it can act as support - The horizontals of the squares are support when the candles are above them and resistance when beneath - The verticals of the squares can assist the candles to climb up or down - Any more questions and i'm going to start putting a tips address oOCatatan
0.00088-0.00090 at the red arc is probably the top end before a retracementCatatan
Catatan
Buy called at 0.00071769Catatan
Bad call - stopped out
Pernyataan Penyangkalan
Informasi dan publikasi ini tidak dimaksudkan, dan bukan merupakan, saran atau rekomendasi keuangan, investasi, trading, atau jenis lainnya yang diberikan atau didukung oleh TradingView. Baca selengkapnya di Ketentuan Penggunaan.
Pernyataan Penyangkalan
Informasi dan publikasi ini tidak dimaksudkan, dan bukan merupakan, saran atau rekomendasi keuangan, investasi, trading, atau jenis lainnya yang diberikan atau didukung oleh TradingView. Baca selengkapnya di Ketentuan Penggunaan.