
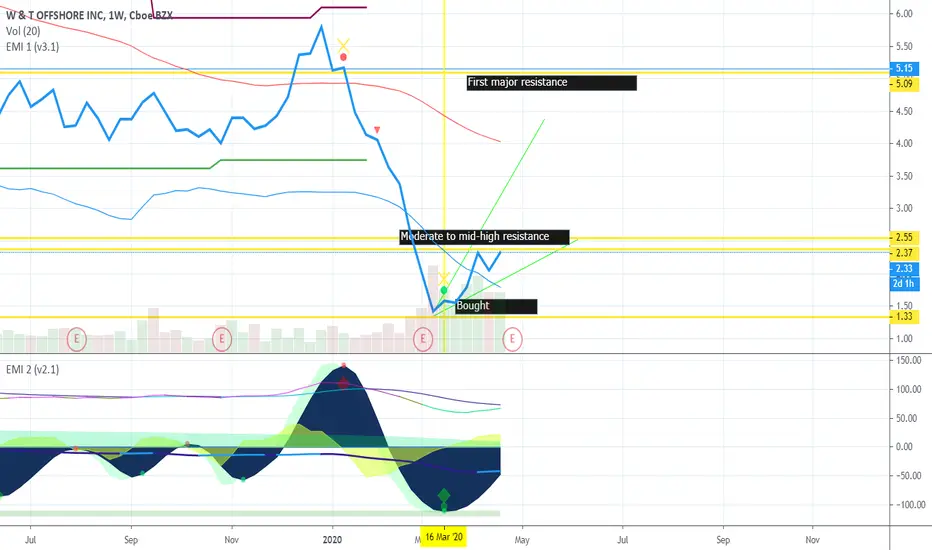
Here is a more in depth analysis of yesterday's published idea. WTI has appeared to have confirmed a new bottom with the EMI after closing repeatedly above bottom support (scripting thanks to bonic) signaling a heavy buy signal on the weekly and monthly charts. We have to manage risk here. I have place a strong watch on the bottom uptrend support around 1.8 up to potentially 2.5 and so on. Stop loss should be used accordingly how low depending on how much you are willing to risk. Though that should be pretty clear if you stay up to date on analysis. immediate resistance but according to EMI appears likely to break through both 2.37-.39 and 2.55-6 resistance lines. If it fails to do so you may consider selling to play safe. Read the charts.
bounce off long term support

same bounce with a more current date range

bounce off long term support
same bounce with a more current date range
Trade aktif
IT has closed aboe 2.55 nice and is using it as support as of now. If i starts to move up next resistance is around 3.5Trade aktif
Continuing upward movement. All indicators still at buy
Pernyataan Penyangkalan
Informasi dan publikasi ini tidak dimaksudkan, dan bukan merupakan, saran atau rekomendasi keuangan, investasi, trading, atau jenis lainnya yang diberikan atau didukung oleh TradingView. Baca selengkapnya di Ketentuan Penggunaan.
Pernyataan Penyangkalan
Informasi dan publikasi ini tidak dimaksudkan, dan bukan merupakan, saran atau rekomendasi keuangan, investasi, trading, atau jenis lainnya yang diberikan atau didukung oleh TradingView. Baca selengkapnya di Ketentuan Penggunaan.