
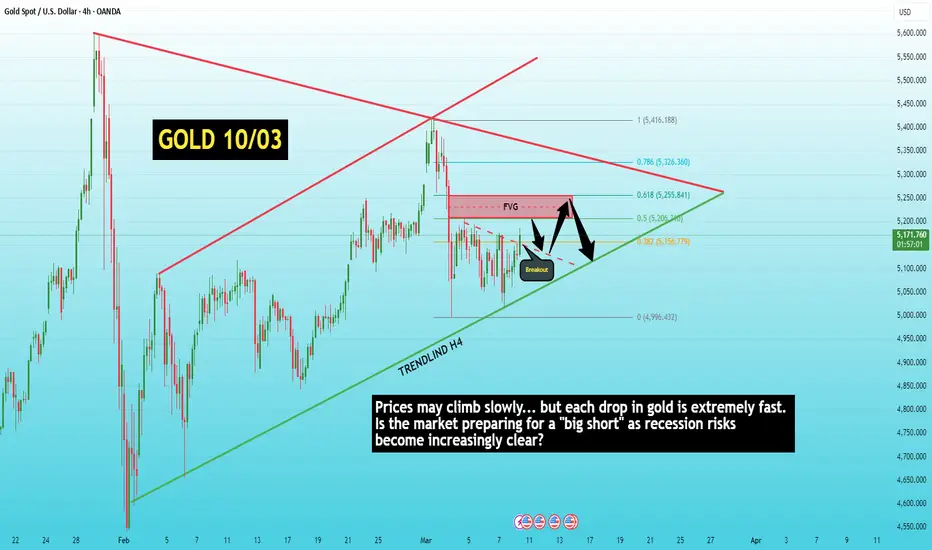
Prices may climb slowly... but each drop in gold is extremely fast. Is the market preparing for a "big short" as recession risks become increasingly clear?
The current macroeconomic context is becoming more complex. Recent U.S. economic data shows signs of labor market weakness, while geopolitical tensions continue to push USD and oil higher. As capital flows back into short-term defensive assets like USD, the market begins to reflect deeper economic recession risks. In many previous cycles, when the economy enters a period of instability, gold often does not rise immediately but may undergo a strong markdown phase before forming a new trend.
On the H4 chart, gold has just broken the short-term downtrend line and surpassed the 0.382 Fibo, confirming that the technical rebound is expanding. Prices are currently moving towards the 0.5 zone (~5200), which is a key liquidity area of the entire previous decline.
However, the overall structure has not truly reversed. Notably, gold's current increases are quite slow and accumulative, while each market sell-off creates very strong dumps. This is often a sign that the market is still in a liquidity distribution phase.
Key levels to watch:
• 5200 (Fibo 0.5): the nearest resistance of the current rebound.
• 5255 – 5260 (Fibo 0.618): major supply zone + potential sell area if reactions occur.
• 5000: critical structural level of the medium-term trend.
If gold is rejected at the 0.5 – 0.618 zone, the market may return to test the 5000 liquidity. In a more negative scenario, if the uptrend line and the 5000 zone are broken, it is highly likely that the market will trigger a big short phase, extending the decline to deeper demand zones.
In other words, even though gold is experiencing a rebound, the medium-term view remains cautiously bearish: the market may continue to rise slowly to attract liquidity above before creating a stronger markdown.
Follow LucasGrayTrading for continuous updates on key levels, liquidity zones, and the gold route map D1 – H4 – H1, helping you track accurately when the market prepares for the next big move.
The current macroeconomic context is becoming more complex. Recent U.S. economic data shows signs of labor market weakness, while geopolitical tensions continue to push USD and oil higher. As capital flows back into short-term defensive assets like USD, the market begins to reflect deeper economic recession risks. In many previous cycles, when the economy enters a period of instability, gold often does not rise immediately but may undergo a strong markdown phase before forming a new trend.
On the H4 chart, gold has just broken the short-term downtrend line and surpassed the 0.382 Fibo, confirming that the technical rebound is expanding. Prices are currently moving towards the 0.5 zone (~5200), which is a key liquidity area of the entire previous decline.
However, the overall structure has not truly reversed. Notably, gold's current increases are quite slow and accumulative, while each market sell-off creates very strong dumps. This is often a sign that the market is still in a liquidity distribution phase.
Key levels to watch:
• 5200 (Fibo 0.5): the nearest resistance of the current rebound.
• 5255 – 5260 (Fibo 0.618): major supply zone + potential sell area if reactions occur.
• 5000: critical structural level of the medium-term trend.
If gold is rejected at the 0.5 – 0.618 zone, the market may return to test the 5000 liquidity. In a more negative scenario, if the uptrend line and the 5000 zone are broken, it is highly likely that the market will trigger a big short phase, extending the decline to deeper demand zones.
In other words, even though gold is experiencing a rebound, the medium-term view remains cautiously bearish: the market may continue to rise slowly to attract liquidity above before creating a stronger markdown.
Follow LucasGrayTrading for continuous updates on key levels, liquidity zones, and the gold route map D1 – H4 – H1, helping you track accurately when the market prepares for the next big move.
Trade aktif
UPDATE PLAN 10/03 – H4 | RETEST TRENDLINE SUCCESS
Gold price has retested the correct downtrend line area + Fibo 0.382 (5160) as per the previous scenario and created a rebound to 5195 ~ 350 pips. Technical reaction shows short-term buying force appearing after the price swept the liquidity area below.
Currently, the market is moving quite slowly, indicating an accumulation state before the US session. If momentum continues, gold may extend the rebound to the upper supply area 5220 – 5255 (FVG + Fibo 0.5–0.618).
However, it should be noted that the larger timeframe trend has not yet reversed, this may still just be a pullback in the downtrend structure.
Key levels to watch:
5160 – retest trendline area + Fibo 0.382
5205 – Fibo 0.5
5220 – 5255 – supply area / FVG H4 timeframe
If the price is rejected at the above area, the sell scenario in line with the downtrend is still prioritized.
Trading ditutup: target tercapai
UPDATE PLAN GOLD 10/03 – H4 | REACTION AFTER SUPPLY HIT
Gold prices have hit the supply FVG area around 5220 and were quickly rejected, creating a drop to 5180 (~400 pips) exactly as per the reaction scenario at the upper liquidity area. This indicates that the 5200–5220 area remains a strong selling zone in the market.
Currently, the price is reacting and accumulating around 5180, indicating that the market is retesting liquidity after the initial rejection.
Short-term scenario:
If the price does not surpass 5200–5220, there is a high possibility that gold will continue to drop to 5160 → 5120.
If it breaks 5200, the price may retest the supply area 5220–5255 again before new selling pressure appears.
Key levels:
• 5220 – 5255: Supply / FVG H4
• 5200: short-term decision area
• 5160: technical support
• 5120 – 5000: liquidity below
The current structure still leans towards a pullback in the downtrend, so any recovery is still an opportunity to follow the sell trend if rejection signals appear at the upper area.
Follow LucasGrayTrading for continuous updates on key levels, liquidity zones, and the gold route map D1 – H4 – H1, helping you track accurately when the market prepares for the next big move.
Catatan
GOLD H2 17/03 | H4 > 5000, REESTABLISH BALANCE TO BREAK THROUGH
After the previous strong decline, gold is currently holding steady above the H4 trendline and shifting to a balanced state on the H2 frame, fluctuating in the 5000–5050 range. This is a typical accumulation phase as the market absorbs previous selling pressure and awaits a new catalyst to expand the range.
In terms of context, the USD continues to maintain strength following recent economic data, while geopolitical factors keep gold in a tug-of-war state. However, the fact that prices are not continuing to fall sharply indicates that sellers are temporarily pausing, creating conditions for a price compression phase on H2.
On the H2 structure, prices are compressing between the descending trendline + short-term ascending trendline, while reacting around the Fibo 0.382–0.5 and intraday FVG area → this is a typical setup for a strong upcoming breakout.
Main Scenario (H2 breakout)
Break above 5050–5070 → extend the recovery to 5100–5150 (FVG + H2 supply)
Break below 5000 → confirm continuation of the downtrend to 4850 → 4700
Key Levels H2
5100 – 5150: Supply / FVG
5050 – 5070: Upper range
5000: Decision zone
4850 – 4700: Lower liquidity
➡️ H2 is in a state of range compression – breaking one of the two ends will trigger an expansion move.
📊 Follow LucasGrayTrading for intraday plan updates on 03/17 and important liquidity zones before the breakout.
Catatan
GOLD 18/03 UPDATE | PLAN HIT PERFECTLY – MARKET NOW AT LIQUIDITY ZONEThe 18/03 plan followed the SELL bias completely from the trendline area 501x. The price only created a weak technical rebound at the retest structure area, then broke down strongly, sweeping all the liquidity below and hitting the exact target area of 483x–485x as the main scenario.
This was a very "clean" move according to the SMC logic: from retest supply → failed breakout → strong displacement downward. There were no signs of reversal throughout the decline, indicating that the sellers completely controlled the cash flow. The scenario was correct not only in direction but also in timing and price area — a textbook setup.
Currently, the market is reacting at the 483x–485x area, which is an important liquidity zone on H4. After sweeping the liquidity below, the price is starting to show signs of pausing and a slight rebound reaction is appearing. However, it must be emphasized that this is only a reaction at liquidity, with no confirmation of a structural reversal.
In this context, if the price cannot reclaim the structure areas above (especially 5000 and further 5050–5100), the downtrend is not yet over. The current rebound is likely just a pullback after completing a liquidity run, before the market decides its next direction.
Overall, the 18/03 plan was excellently executed in terms of bias, structure, and execution. This is a typical example of following the cash flow — no need to predict, just read the price action and liquidity correctly.
The market is now entering a sensitive phase after sweeping large liquidity, with a high possibility of strong volatility ahead when combined with FOMC news.
Follow liquidity — not the news.
📊 Today's 19/03 plan will focus on the scenario after liquidity has been swept — whether to continue breaking down or form a larger rebound. Follow LucasGrayTrading to update the roadmap & new setup before the market continues to move.

Daily trend & Supply/Demand insights 📊
👉 t.me/+WR75kcwrAOw3MzZl
High-probability zones & structured setups
Clear scenarios for better decision-making
Trade smarter with LucasGrayTrading 🎖
👉 t.me/+WR75kcwrAOw3MzZl
High-probability zones & structured setups
Clear scenarios for better decision-making
Trade smarter with LucasGrayTrading 🎖
Pernyataan Penyangkalan
Informasi dan publikasi ini tidak dimaksudkan, dan bukan merupakan, saran atau rekomendasi keuangan, investasi, trading, atau jenis lainnya yang diberikan atau didukung oleh TradingView. Baca selengkapnya di Ketentuan Penggunaan.
Daily trend & Supply/Demand insights 📊
👉 t.me/+WR75kcwrAOw3MzZl
High-probability zones & structured setups
Clear scenarios for better decision-making
Trade smarter with LucasGrayTrading 🎖
👉 t.me/+WR75kcwrAOw3MzZl
High-probability zones & structured setups
Clear scenarios for better decision-making
Trade smarter with LucasGrayTrading 🎖
Pernyataan Penyangkalan
Informasi dan publikasi ini tidak dimaksudkan, dan bukan merupakan, saran atau rekomendasi keuangan, investasi, trading, atau jenis lainnya yang diberikan atau didukung oleh TradingView. Baca selengkapnya di Ketentuan Penggunaan.