
Description
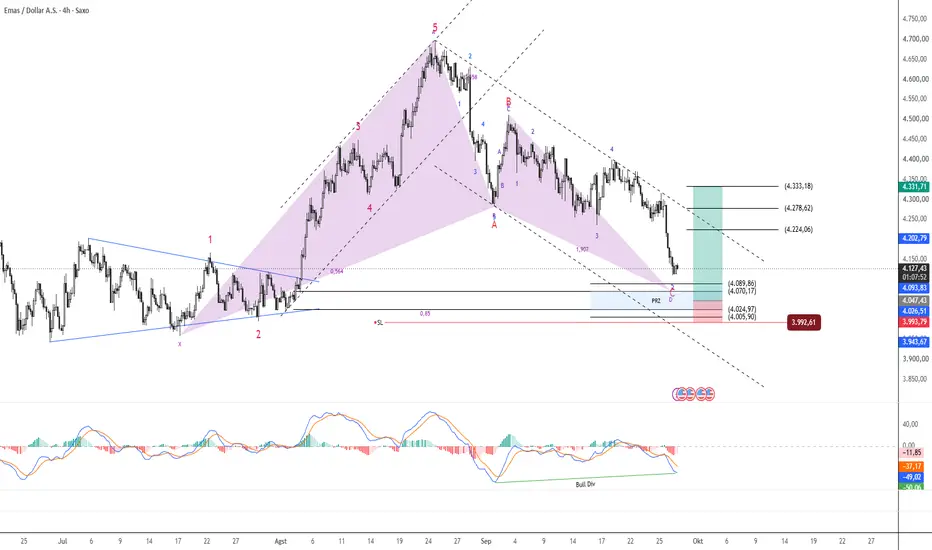
XAUUSD is approaching a key Potential Reversal Zone (PRZ) around 4,005–4,090, where a bullish harmonic structure appears to be reaching its completion at point D.
At the same time, the Elliott Wave structure suggests that the current bearish sequence may be approaching the completion of Wave 5 / Wave C, creating a potential confluence for a bullish reaction.
The main idea is to wait for confirmation inside the PRZ rather than anticipating the reversal too early.
Key Levels:
The descending trendline remains an important resistance. A confirmed breakout above this structure would strengthen the bullish reversal scenario.
My approach here is to use the Harmonic Pattern as the map to identify the reversal area, while Elliott Wave is used to understand the internal market structure and timing of the potential completion.
The setup becomes more interesting if price enters the PRZ and shows signs of exhaustion, bullish divergence, rejection candles, or a lower-timeframe impulsive reversal.
Invalidation:
A decisive breakdown below the PRZ and the 3,992 area would invalidate the current bullish scenario and suggest that the bearish structure is still developing.
This is a technical analysis scenario, not financial advice. Wait for confirmation and manage risk accordingly.
XAUUSD is approaching a key Potential Reversal Zone (PRZ) around 4,005–4,090, where a bullish harmonic structure appears to be reaching its completion at point D.
At the same time, the Elliott Wave structure suggests that the current bearish sequence may be approaching the completion of Wave 5 / Wave C, creating a potential confluence for a bullish reaction.
The main idea is to wait for confirmation inside the PRZ rather than anticipating the reversal too early.
Key Levels:
- PRZ: 4,005–4,090
- Invalidation / SL: below 3,992
- TP1: 4,224 — 38.2%
- TP2: 4,279 — 50.0%
- TP3: 4,333 — 61.8%
The descending trendline remains an important resistance. A confirmed breakout above this structure would strengthen the bullish reversal scenario.
My approach here is to use the Harmonic Pattern as the map to identify the reversal area, while Elliott Wave is used to understand the internal market structure and timing of the potential completion.
The setup becomes more interesting if price enters the PRZ and shows signs of exhaustion, bullish divergence, rejection candles, or a lower-timeframe impulsive reversal.
Invalidation:
A decisive breakdown below the PRZ and the 3,992 area would invalidate the current bullish scenario and suggest that the bearish structure is still developing.
This is a technical analysis scenario, not financial advice. Wait for confirmation and manage risk accordingly.

Pernyataan Penyangkalan
Informasi dan publikasi ini tidak dimaksudkan, dan bukan merupakan, saran atau rekomendasi keuangan, investasi, trading, atau jenis lainnya yang diberikan atau didukung oleh TradingView. Baca selengkapnya di Ketentuan Penggunaan.
Pernyataan Penyangkalan
Informasi dan publikasi ini tidak dimaksudkan, dan bukan merupakan, saran atau rekomendasi keuangan, investasi, trading, atau jenis lainnya yang diberikan atau didukung oleh TradingView. Baca selengkapnya di Ketentuan Penggunaan.