
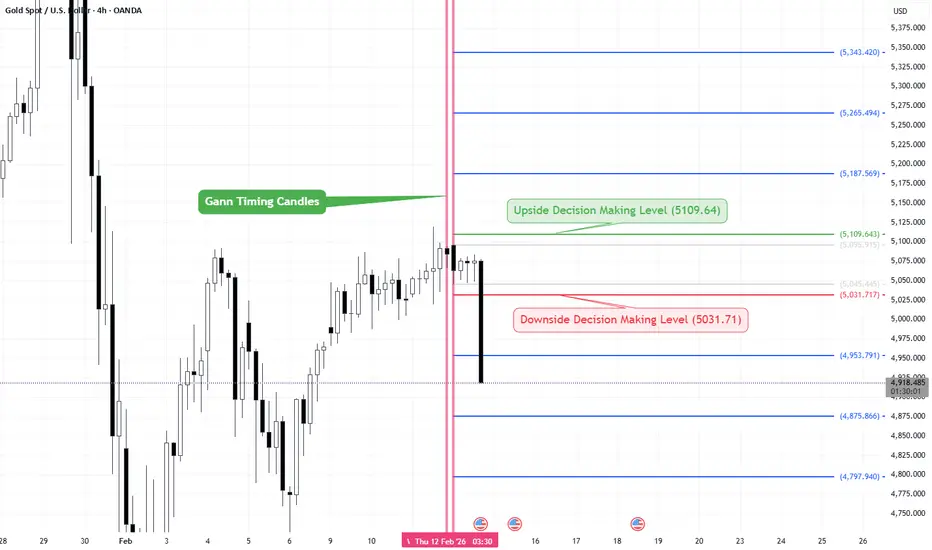
- Gann Time Cycles have been plotted and highlighted with vertical lines. These mark the key candles to watch.
- The combined high and low of these important candles are marked, with a minor buffer added to reduce the risk of false breakouts.
Resistance Setup
- Green Line – 5109.64 → Resistance level
- If a candle closes above 5109.64, expect upward momentum.
- Stoploss: Red Line – 5031.71
- Targets: Sequential Blue Lines
Support Setup
- Red Line – 5031.71 → Support level
- If a candle closes below 5031.71, expect downward momentum.
- Stoploss: Green Line – 5109.64
- Targets: Sequential Blue Lines
- The combined high and low of these important candles are marked, with a minor buffer added to reduce the risk of false breakouts.
Resistance Setup
- Green Line – 5109.64 → Resistance level
- If a candle closes above 5109.64, expect upward momentum.
- Stoploss: Red Line – 5031.71
- Targets: Sequential Blue Lines
Support Setup
- Red Line – 5031.71 → Support level
- If a candle closes below 5031.71, expect downward momentum.
- Stoploss: Green Line – 5109.64
- Targets: Sequential Blue Lines

Pernyataan Penyangkalan
Informasi dan publikasi ini tidak dimaksudkan, dan bukan merupakan, saran atau rekomendasi keuangan, investasi, trading, atau jenis lainnya yang diberikan atau didukung oleh TradingView. Baca selengkapnya di Ketentuan Penggunaan.
Pernyataan Penyangkalan
Informasi dan publikasi ini tidak dimaksudkan, dan bukan merupakan, saran atau rekomendasi keuangan, investasi, trading, atau jenis lainnya yang diberikan atau didukung oleh TradingView. Baca selengkapnya di Ketentuan Penggunaan.