
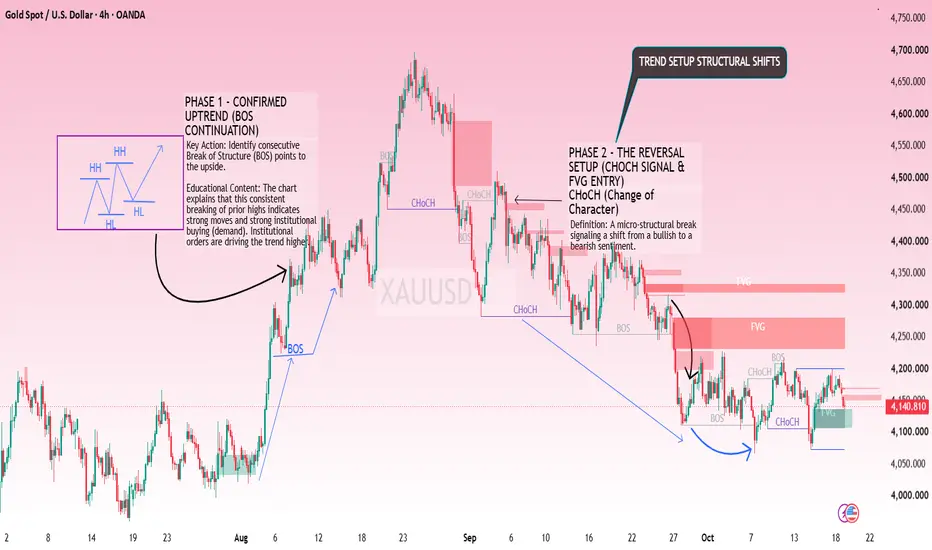
Bullish trend to a bearish trend using Smart Money Concepts (SMC).
The educational content focuses on two phases:
Phase 1: Bullish trend continuation (BOS).
Phase 2: Bearish reversal (CHoCH), followed by bearish structure and Fair Value Gap (FVG) zones.
Let's break down the chart and understand how to use these concepts in trading.
1. Phase 1 — Confirmed Bullish Trend
Period: Late July to late August.
In the first phase, gold was forming a bullish market structure.
What happened?
HH (Higher High): Price made a new high above the previous swing high.
HL (Higher Low): Price pulled back but held above the previous swing low.
BOS (Break of Structure): Price broke above a previous swing high, supporting bullish continuation.
The chart shows several bullish structure breaks, particularly during the strong upward movement in early and late August.
What does this mean?
The market was demonstrating bullish momentum, with buyers maintaining control.
Educational trading principle: When the market repeatedly creates higher highs and higher lows, traders generally look for buying opportunities during pullbacks rather than selling against the trend.
However, a BOS is not a guarantee that the trend will continue. The break should be evaluated alongside candle closes, momentum, and the surrounding market structure.
2. Phase 2 — Change of Character (CHoCH)
Period: Late August to September.
This is the most important transition in the chart.
Gold reached a peak around the 4,650–4,700 region before experiencing a sharp decline.
What is CHoCH?
CHoCH means Change of Character.
In Smart Money Concepts, it refers to a structural break that may signal a shift in market direction.
For example:
Before the reversal, gold was making higher highs and higher lows.
Price then broke an important higher low.
This suggested that bullish structure was weakening and bearish pressure was increasing.
What does the chart show?
The chart marks CHoCH around the transition from the bullish phase to the bearish phase.
After this transition:
Gold made lower highs.
Price broke below previous swing lows.
Selling pressure became more apparent.
The market began establishing a bearish structure.
Important distinction: A CHoCH is an early warning of a possible reversal, not confirmation that every subsequent move must be bearish. A convincing break of structure and subsequent price action provide additional evidence.
3. Phase 3 — Bearish Break of Structure (BOS)
Following the initial reversal, the chart shows additional bearish structure breaks.
How to interpret this
The bearish sequence generally consists of:
Price breaks below a previous swing low.
Price retraces upward.
The retracement fails to break the relevant lower high.
Price moves downward again and breaks another swing low.
This creates a bearish pattern of Lower Highs (LH) and Lower Lows (LL).
The September decline illustrates this pattern.
Why is this important?
When bearish BOS events follow a bearish CHoCH, they provide stronger evidence of a developing downtrend than a single structural break alone.
A trader following this approach might look for a pullback into a resistance area rather than entering immediately after a large bearish candle.
4. Fair Value Gap (FVG) — Potential Trading Zones
The red rectangles on the chart represent bearish Fair Value Gaps.
What is an FVG?
A Fair Value Gap is a three-candle price pattern associated with a rapid directional move.
A bearish FVG typically forms when the high of the third candle remains below the low of the first candle, leaving a price range with limited overlap between the candles.
Traders monitor these areas because price may later retrace into them.
FVG zones shown in the chart
Based on the approximate price scale, the marked zones include:
Zone
The educational content focuses on two phases:
Phase 1: Bullish trend continuation (BOS).
Phase 2: Bearish reversal (CHoCH), followed by bearish structure and Fair Value Gap (FVG) zones.
Let's break down the chart and understand how to use these concepts in trading.
1. Phase 1 — Confirmed Bullish Trend
Period: Late July to late August.
In the first phase, gold was forming a bullish market structure.
What happened?
HH (Higher High): Price made a new high above the previous swing high.
HL (Higher Low): Price pulled back but held above the previous swing low.
BOS (Break of Structure): Price broke above a previous swing high, supporting bullish continuation.
The chart shows several bullish structure breaks, particularly during the strong upward movement in early and late August.
What does this mean?
The market was demonstrating bullish momentum, with buyers maintaining control.
Educational trading principle: When the market repeatedly creates higher highs and higher lows, traders generally look for buying opportunities during pullbacks rather than selling against the trend.
However, a BOS is not a guarantee that the trend will continue. The break should be evaluated alongside candle closes, momentum, and the surrounding market structure.
2. Phase 2 — Change of Character (CHoCH)
Period: Late August to September.
This is the most important transition in the chart.
Gold reached a peak around the 4,650–4,700 region before experiencing a sharp decline.
What is CHoCH?
CHoCH means Change of Character.
In Smart Money Concepts, it refers to a structural break that may signal a shift in market direction.
For example:
Before the reversal, gold was making higher highs and higher lows.
Price then broke an important higher low.
This suggested that bullish structure was weakening and bearish pressure was increasing.
What does the chart show?
The chart marks CHoCH around the transition from the bullish phase to the bearish phase.
After this transition:
Gold made lower highs.
Price broke below previous swing lows.
Selling pressure became more apparent.
The market began establishing a bearish structure.
Important distinction: A CHoCH is an early warning of a possible reversal, not confirmation that every subsequent move must be bearish. A convincing break of structure and subsequent price action provide additional evidence.
3. Phase 3 — Bearish Break of Structure (BOS)
Following the initial reversal, the chart shows additional bearish structure breaks.
How to interpret this
The bearish sequence generally consists of:
Price breaks below a previous swing low.
Price retraces upward.
The retracement fails to break the relevant lower high.
Price moves downward again and breaks another swing low.
This creates a bearish pattern of Lower Highs (LH) and Lower Lows (LL).
The September decline illustrates this pattern.
Why is this important?
When bearish BOS events follow a bearish CHoCH, they provide stronger evidence of a developing downtrend than a single structural break alone.
A trader following this approach might look for a pullback into a resistance area rather than entering immediately after a large bearish candle.
4. Fair Value Gap (FVG) — Potential Trading Zones
The red rectangles on the chart represent bearish Fair Value Gaps.
What is an FVG?
A Fair Value Gap is a three-candle price pattern associated with a rapid directional move.
A bearish FVG typically forms when the high of the third candle remains below the low of the first candle, leaving a price range with limited overlap between the candles.
Traders monitor these areas because price may later retrace into them.
FVG zones shown in the chart
Based on the approximate price scale, the marked zones include:
Zone
Trade aktif
Setup Recap & Execution BreakdownThe Setup (FVG Reaction):
As analyzed in our initial trade idea, price retraced cleanly into the marked 4H Fair Value Gap (FVG) zone around 4106.
Institutional demand stepped in precisely within this zone, validating the bullish market structure shift.
The Move:
Buyers took control immediately from the 4106 low, driving a powerful impulse move straight up to the 4140 level.
This expansion delivered a seamless +360 pips rally from entry to local high (+340 pips straight to target).

Pernyataan Penyangkalan
Informasi dan publikasi ini tidak dimaksudkan, dan bukan merupakan, saran atau rekomendasi keuangan, investasi, trading, atau jenis lainnya yang diberikan atau didukung oleh TradingView. Baca selengkapnya di Ketentuan Penggunaan.
Pernyataan Penyangkalan
Informasi dan publikasi ini tidak dimaksudkan, dan bukan merupakan, saran atau rekomendasi keuangan, investasi, trading, atau jenis lainnya yang diberikan atau didukung oleh TradingView. Baca selengkapnya di Ketentuan Penggunaan.