
◆ Market Context
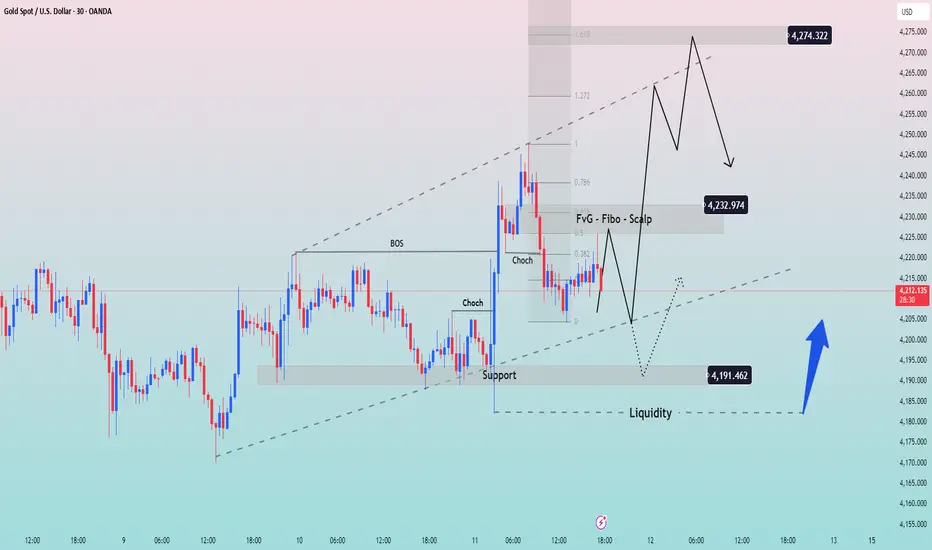
After breaking a bullish BOS, Gold pushed strongly toward 4,232 before losing momentum. Subsequent pullbacks formed a bearish CHoCH, signalling that the corrective wave is weakening and the market needs rebalancing before choosing its next direction.
Price is now sitting inside the short-term ascending channel, near the FVG – Fibo – Scalp zone where strong reactions typically occur.
◆ SMC & Price Action
• The 4,191 support remains a key structural low where strong buying previously broke BOS.
• The FVG around 4,232 is an area where sellers may react since it was created during the fast drop.
• The ascending trendline is still supporting price, but if it breaks, liquidity below 4,191 may be swept before any recovery.
◆ Main Trading Scenarios
➤ Scenario 1: Price rejects the 4,232 FVG → Short-term Sell bias
• Conditions: rejection candle / weakness pattern at 4,230–4,233
• Targets:
▪ 4,210
▪ 4,191 (strong support)
➤ Scenario 2: Price breaks through FVG and extends into Fibo expansion → Look for Sell signals
• Fibo extension targets: 4,255–4,274
• Look for reversal signals to Sell in line with the larger trend.
➤ Scenario 3: Buy from support if liquidity is swept
• Ideal Buy zone: 4,191 → liquidity below 4,185
• Conditions: strong reaction or bullish CHoCH
• Targets:
▪ 4,215
▪ 4,232 (FVG)
◆ Summary
• FVG 4,232 is the key area for short-term trend direction.
• Sell-the-reaction at the FVG remains high-probability.
• If price returns to 4,191 support and holds → potential for a strong Buy.
• If support breaks, market may sweep deeper liquidity before forming a new low.
After breaking a bullish BOS, Gold pushed strongly toward 4,232 before losing momentum. Subsequent pullbacks formed a bearish CHoCH, signalling that the corrective wave is weakening and the market needs rebalancing before choosing its next direction.
Price is now sitting inside the short-term ascending channel, near the FVG – Fibo – Scalp zone where strong reactions typically occur.
◆ SMC & Price Action
• The 4,191 support remains a key structural low where strong buying previously broke BOS.
• The FVG around 4,232 is an area where sellers may react since it was created during the fast drop.
• The ascending trendline is still supporting price, but if it breaks, liquidity below 4,191 may be swept before any recovery.
◆ Main Trading Scenarios
➤ Scenario 1: Price rejects the 4,232 FVG → Short-term Sell bias
• Conditions: rejection candle / weakness pattern at 4,230–4,233
• Targets:
▪ 4,210
▪ 4,191 (strong support)
➤ Scenario 2: Price breaks through FVG and extends into Fibo expansion → Look for Sell signals
• Fibo extension targets: 4,255–4,274
• Look for reversal signals to Sell in line with the larger trend.
➤ Scenario 3: Buy from support if liquidity is swept
• Ideal Buy zone: 4,191 → liquidity below 4,185
• Conditions: strong reaction or bullish CHoCH
• Targets:
▪ 4,215
▪ 4,232 (FVG)
◆ Summary
• FVG 4,232 is the key area for short-term trend direction.
• Sell-the-reaction at the FVG remains high-probability.
• If price returns to 4,191 support and holds → potential for a strong Buy.
• If support breaks, market may sweep deeper liquidity before forming a new low.

Join Community Gold BMR_MasteTrade:
t.me/+p2iJeq3yBUYyNDJl
t.me/+p2iJeq3yBUYyNDJl
Pernyataan Penyangkalan
Informasi dan publikasi ini tidak dimaksudkan, dan bukan merupakan, saran atau rekomendasi keuangan, investasi, trading, atau jenis lainnya yang diberikan atau didukung oleh TradingView. Baca selengkapnya di Ketentuan Penggunaan.
Join Community Gold BMR_MasteTrade:
t.me/+p2iJeq3yBUYyNDJl
t.me/+p2iJeq3yBUYyNDJl
Pernyataan Penyangkalan
Informasi dan publikasi ini tidak dimaksudkan, dan bukan merupakan, saran atau rekomendasi keuangan, investasi, trading, atau jenis lainnya yang diberikan atau didukung oleh TradingView. Baca selengkapnya di Ketentuan Penggunaan.