
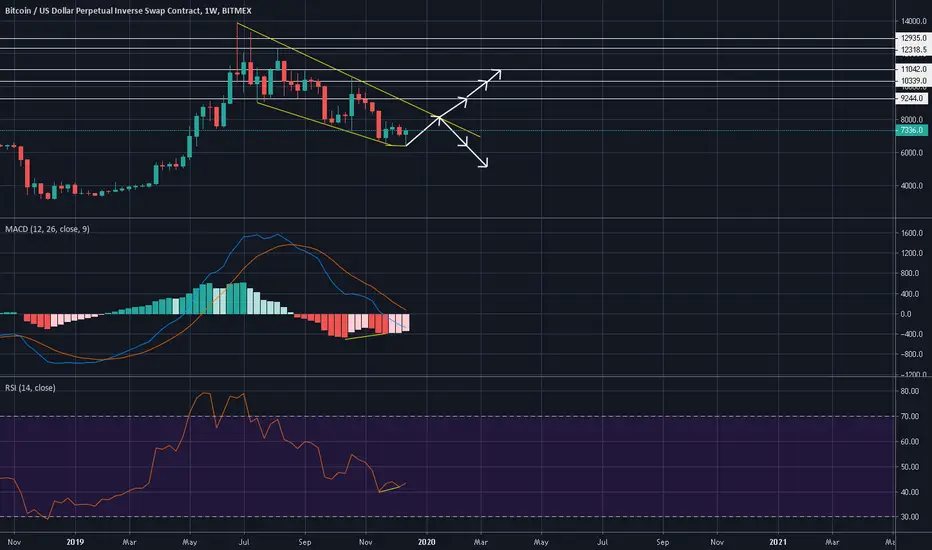
I see bullish divergence at macd histogram and rsi on weekly chart.
I expect a bullish move to 8157 price level and if breakout comes from channel (8157 price level), we can see bullish move to 9244, 10339, 11042, 12318, 12935.
If price decline the yellow line resistance (8157 price level) , we can see downwards move to 6400 and 5560.
If you have different ideas, please share your ideas with us below comment section.
Have a nice day,
Berk.
I expect a bullish move to 8157 price level and if breakout comes from channel (8157 price level), we can see bullish move to 9244, 10339, 11042, 12318, 12935.
If price decline the yellow line resistance (8157 price level) , we can see downwards move to 6400 and 5560.
If you have different ideas, please share your ideas with us below comment section.
Have a nice day,
Berk.
Trading ditutup: target tercapai
1st target reached, congrats to all who traded with us :)
Pernyataan Penyangkalan
Informasi dan publikasi ini tidak dimaksudkan, dan bukan merupakan, saran atau rekomendasi keuangan, investasi, trading, atau jenis lainnya yang diberikan atau didukung oleh TradingView. Baca selengkapnya di Ketentuan Penggunaan.
Pernyataan Penyangkalan
Informasi dan publikasi ini tidak dimaksudkan, dan bukan merupakan, saran atau rekomendasi keuangan, investasi, trading, atau jenis lainnya yang diberikan atau didukung oleh TradingView. Baca selengkapnya di Ketentuan Penggunaan.