XLM weekly chart looks very good. Bullish breakout is imminent.
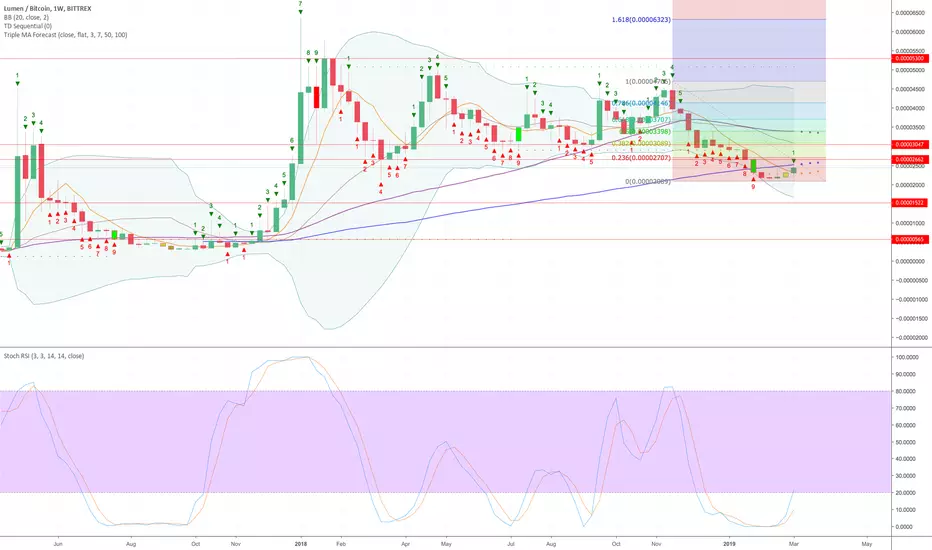
XLM gave a green 1 according to Tom Demark count on the weekly chart. Stoch RSI is oversold on the weekly chart and MA7 level is broken. On the daily chart we have closed yesterday with a green 2 which is a clear buy signal. I expect a bullish breakout. First big resistance will be at weekly MA100 level which passes at: 2521. If it can break that level I expect the price continue to increase. You can find resistance and support levels on the chart.
Here is my trading idea:
Buy @ 2380-2410 TP1: 2500 TP2: 2700 SL: 2050
***This information is not a recommendation to buy or sell. It is to be used for educational purposes only.***
Here is my trading idea:
Buy @ 2380-2410 TP1: 2500 TP2: 2700 SL: 2050
***This information is not a recommendation to buy or sell. It is to be used for educational purposes only.***
Catatan
TP1 is reached.Catatan
TP2 is reached.Trading ditutup: target tercapai

I trade with real-time liquidation data.
Heatmap I use live: liqheat.com
Heatmap I use live: liqheat.com
Pernyataan Penyangkalan
Informasi dan publikasi ini tidak dimaksudkan, dan bukan merupakan, saran atau rekomendasi keuangan, investasi, trading, atau jenis lainnya yang diberikan atau didukung oleh TradingView. Baca selengkapnya di Ketentuan Penggunaan.
I trade with real-time liquidation data.
Heatmap I use live: liqheat.com
Heatmap I use live: liqheat.com
Pernyataan Penyangkalan
Informasi dan publikasi ini tidak dimaksudkan, dan bukan merupakan, saran atau rekomendasi keuangan, investasi, trading, atau jenis lainnya yang diberikan atau didukung oleh TradingView. Baca selengkapnya di Ketentuan Penggunaan.