
ANALYSIS 🔎
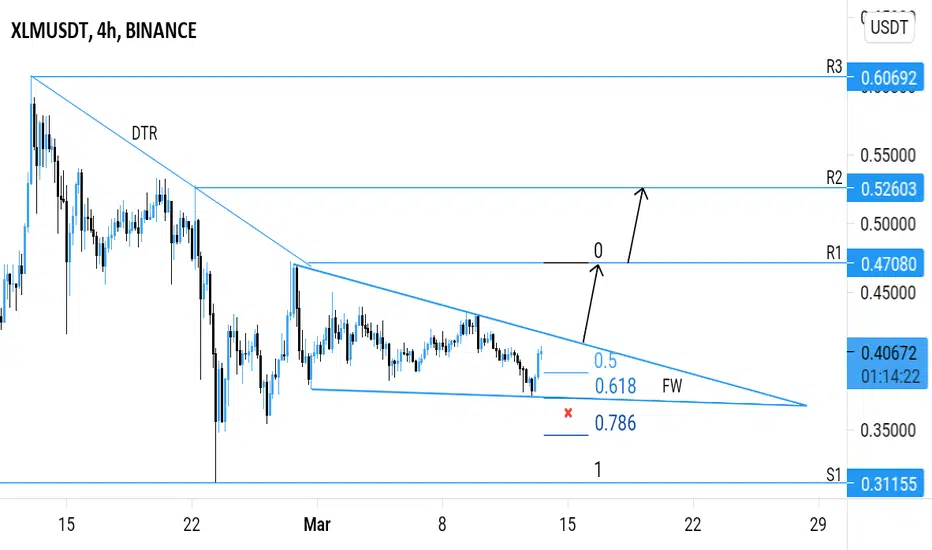
- XLMUSDT brokeout above the descending trendline resistance and retraced
- Price is testing the key fibonacci retracement zone (0.5 - 0.618 - 0.786).
- Price action is printing the falling wedge (FW) pattern.
- There's a breakout potential.
BUY ENTRY ⬆️
- Breakout above the falling wedge's resistance.
TARGETS 🎯
- Horizontal resistance level (R1).
- Horizontal resistance level (R2).
SETUP INVALIDATION ❌
- Breakdown below the falling wedge's support.
- This breakdown will probably lead to the retest of the horizontal support level (S1).
- Which if it holds, will lead to the formation of the double bottom bullish reversal pattern.
- XLMUSDT brokeout above the descending trendline resistance and retraced
- Price is testing the key fibonacci retracement zone (0.5 - 0.618 - 0.786).
- Price action is printing the falling wedge (FW) pattern.
- There's a breakout potential.
BUY ENTRY ⬆️
- Breakout above the falling wedge's resistance.
TARGETS 🎯
- Horizontal resistance level (R1).
- Horizontal resistance level (R2).
SETUP INVALIDATION ❌
- Breakdown below the falling wedge's support.
- This breakdown will probably lead to the retest of the horizontal support level (S1).
- Which if it holds, will lead to the formation of the double bottom bullish reversal pattern.

Pernyataan Penyangkalan
Informasi dan publikasi ini tidak dimaksudkan, dan bukan merupakan, saran atau rekomendasi keuangan, investasi, trading, atau jenis lainnya yang diberikan atau didukung oleh TradingView. Baca selengkapnya di Ketentuan Penggunaan.
Pernyataan Penyangkalan
Informasi dan publikasi ini tidak dimaksudkan, dan bukan merupakan, saran atau rekomendasi keuangan, investasi, trading, atau jenis lainnya yang diberikan atau didukung oleh TradingView. Baca selengkapnya di Ketentuan Penggunaan.