
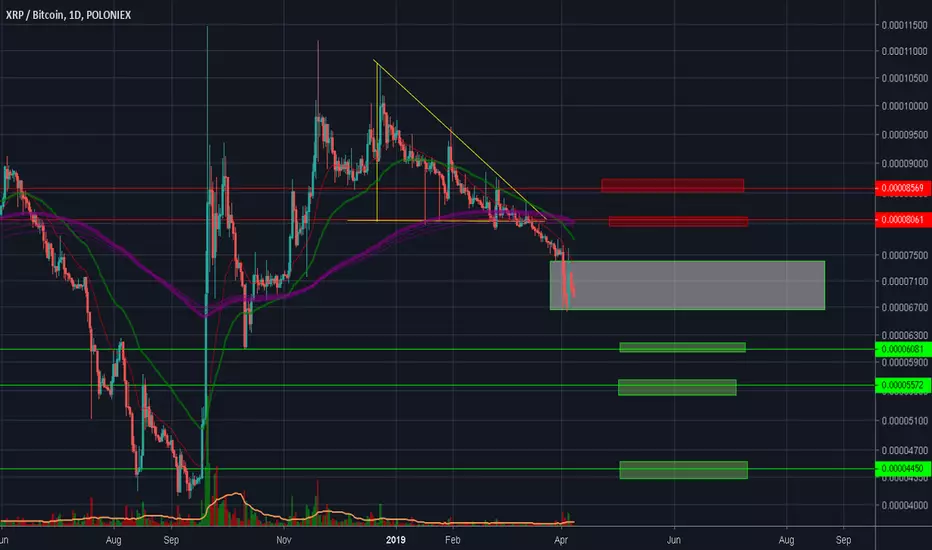
After the price action cannot manage to get through 200 EMA line.. 8200 satoshi.. The downtrend is confirmed by the downward price movement and break the descending triangle toward bearish area.
from stochastic RSI and MACD shown a continuation of downward trend ;


Support #1 : +- 6100 satoshi
Support #2 : +- 5500 satoshi
Resistance #1 : +- 8000 satoshi
Resistance #2 : +- 8500 satoshi
please let me share what your thought/idea/chart about this idea in the comment section..
peace
from stochastic RSI and MACD shown a continuation of downward trend ;
Support #1 : +- 6100 satoshi
Support #2 : +- 5500 satoshi
Resistance #1 : +- 8000 satoshi
Resistance #2 : +- 8500 satoshi
please let me share what your thought/idea/chart about this idea in the comment section..
peace
Catatan
This is a important trend line from december 2017 until today XRP/BTC.. cant wait what is going to happen for XRP/BTC
Publikasi terkait
Pernyataan Penyangkalan
Informasi dan publikasi ini tidak dimaksudkan, dan bukan merupakan, saran atau rekomendasi keuangan, investasi, trading, atau jenis lainnya yang diberikan atau didukung oleh TradingView. Baca selengkapnya di Ketentuan Penggunaan.
Publikasi terkait
Pernyataan Penyangkalan
Informasi dan publikasi ini tidak dimaksudkan, dan bukan merupakan, saran atau rekomendasi keuangan, investasi, trading, atau jenis lainnya yang diberikan atau didukung oleh TradingView. Baca selengkapnya di Ketentuan Penggunaan.