
Market Overview
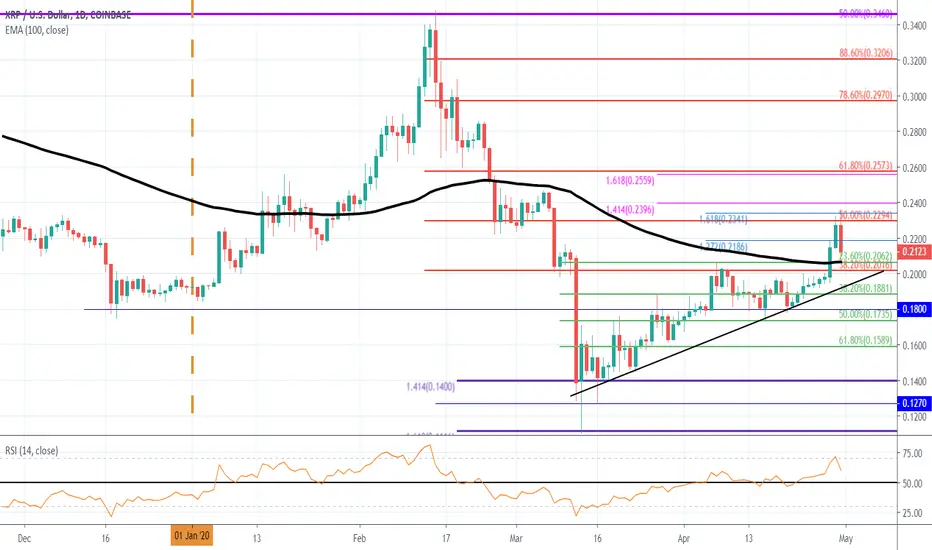
XRP managed to increase by 15% this week as the cryptocurrency finally broke above the $0.20 level. The cryptocurrency had been struggling to break above $0.20 since the March market collapse but managed to penetrate above here on Tuesday when it surged past the 100-days EMA at $0.206 and closed at $0.218 (1.272 Fib Extension).
Yesterday, XRP continued higher into the bearish .5 Fib Retracement level at $0.23. In today’s trading session, XRP has dropped lower as it trades at $0.218.
Short term prediction: BULLISH
The break above $0.20 has now turned XRP bullish and it would need to drop beneath $0.20 to turn neutral again. If it was to drop beneath $0.18, the market would be considered as bearish.
If the buyers manage to rebound from $0.218 and push higher, the first level of strong resistance lies at $0.229 (bearish .5 Fib Retracement). Above this, resistance is located at $0.234, $0.24 (1.414 Fib Extension), and $0.257 (bearish .618 Fib Retracement).
Toward the downside, support lies at $0.21, $0.206 (100-days EMA & .236 Fib Retracement), $0.20, and $0.1881 (.382 Fib Retracement). Following this, added support lies at $0.18.
The RSI has dropped from overbought conditions as the bullish momentum is starting to show some signs of weakness.
XRP managed to increase by 15% this week as the cryptocurrency finally broke above the $0.20 level. The cryptocurrency had been struggling to break above $0.20 since the March market collapse but managed to penetrate above here on Tuesday when it surged past the 100-days EMA at $0.206 and closed at $0.218 (1.272 Fib Extension).
Yesterday, XRP continued higher into the bearish .5 Fib Retracement level at $0.23. In today’s trading session, XRP has dropped lower as it trades at $0.218.
Short term prediction: BULLISH
The break above $0.20 has now turned XRP bullish and it would need to drop beneath $0.20 to turn neutral again. If it was to drop beneath $0.18, the market would be considered as bearish.
If the buyers manage to rebound from $0.218 and push higher, the first level of strong resistance lies at $0.229 (bearish .5 Fib Retracement). Above this, resistance is located at $0.234, $0.24 (1.414 Fib Extension), and $0.257 (bearish .618 Fib Retracement).
Toward the downside, support lies at $0.21, $0.206 (100-days EMA & .236 Fib Retracement), $0.20, and $0.1881 (.382 Fib Retracement). Following this, added support lies at $0.18.
The RSI has dropped from overbought conditions as the bullish momentum is starting to show some signs of weakness.

Pernyataan Penyangkalan
Informasi dan publikasi ini tidak dimaksudkan, dan bukan merupakan, saran atau rekomendasi keuangan, investasi, trading, atau jenis lainnya yang diberikan atau didukung oleh TradingView. Baca selengkapnya di Ketentuan Penggunaan.
Pernyataan Penyangkalan
Informasi dan publikasi ini tidak dimaksudkan, dan bukan merupakan, saran atau rekomendasi keuangan, investasi, trading, atau jenis lainnya yang diberikan atau didukung oleh TradingView. Baca selengkapnya di Ketentuan Penggunaan.