
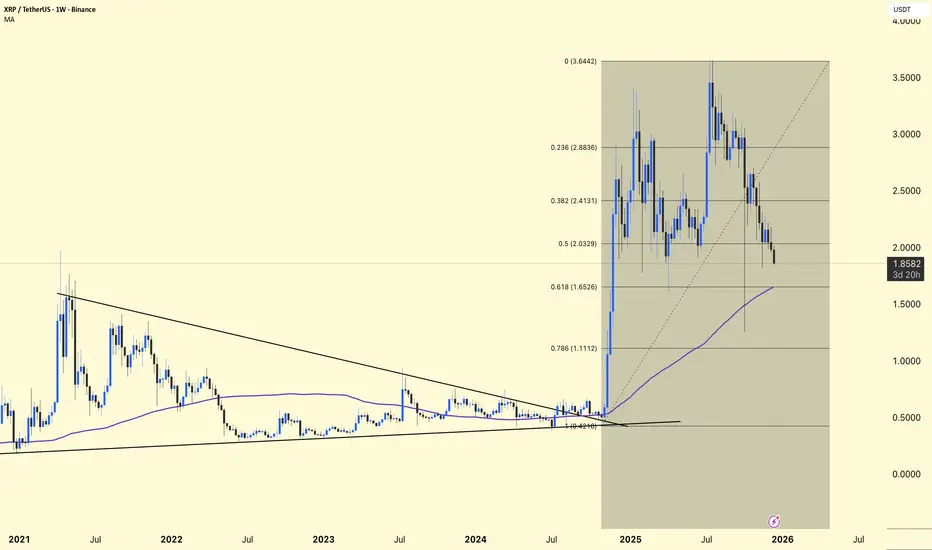
XRP/USDT – Chart Analysis (Weekly)
XRP has broken out of a multi-year downtrend line → confirming a major trend reversal
Strong impulsive rally after prolonged accumulation
The current price action is a healthy corrective pullback, not a bearish reversal
As long as the higher support zones hold, the structure remains bullish.
Fibonacci Analysis.
(Fibonacci drawn from macro low → to recent high)
0.236 – 2.88 → Strong rejection zone (local top)
0.382 – 2.41 → Supply / Resistance
0.5 – 2.03 → Mid-range level
0.618 – 1.65 → Golden Support Zone
0.786 – 1.11 → Strong demand and last bullish defense
The price is currently trading between 0.5 and 0.618, close to a high-probability demand zone.
Moving Average Confirmation
The price is still above the rising weekly MA (~1.65)
The MA is acting as dynamic support
In a bull cycle, the price often dips below the MA and recovers
As long as the weekly closes remain near/above the MA, the bullish trend remains intact.
DYOR | NFA.
XRP has broken out of a multi-year downtrend line → confirming a major trend reversal
Strong impulsive rally after prolonged accumulation
The current price action is a healthy corrective pullback, not a bearish reversal
As long as the higher support zones hold, the structure remains bullish.
Fibonacci Analysis.
(Fibonacci drawn from macro low → to recent high)
0.236 – 2.88 → Strong rejection zone (local top)
0.382 – 2.41 → Supply / Resistance
0.5 – 2.03 → Mid-range level
0.618 – 1.65 → Golden Support Zone
0.786 – 1.11 → Strong demand and last bullish defense
The price is currently trading between 0.5 and 0.618, close to a high-probability demand zone.
Moving Average Confirmation
The price is still above the rising weekly MA (~1.65)
The MA is acting as dynamic support
In a bull cycle, the price often dips below the MA and recovers
As long as the weekly closes remain near/above the MA, the bullish trend remains intact.
DYOR | NFA.

Publikasi terkait
Pernyataan Penyangkalan
Informasi dan publikasi ini tidak dimaksudkan, dan bukan merupakan, saran atau rekomendasi keuangan, investasi, trading, atau jenis lainnya yang diberikan atau didukung oleh TradingView. Baca selengkapnya di Ketentuan Penggunaan.
Publikasi terkait
Pernyataan Penyangkalan
Informasi dan publikasi ini tidak dimaksudkan, dan bukan merupakan, saran atau rekomendasi keuangan, investasi, trading, atau jenis lainnya yang diberikan atau didukung oleh TradingView. Baca selengkapnya di Ketentuan Penggunaan.