Pembelian
VERGE Double Bottom ?
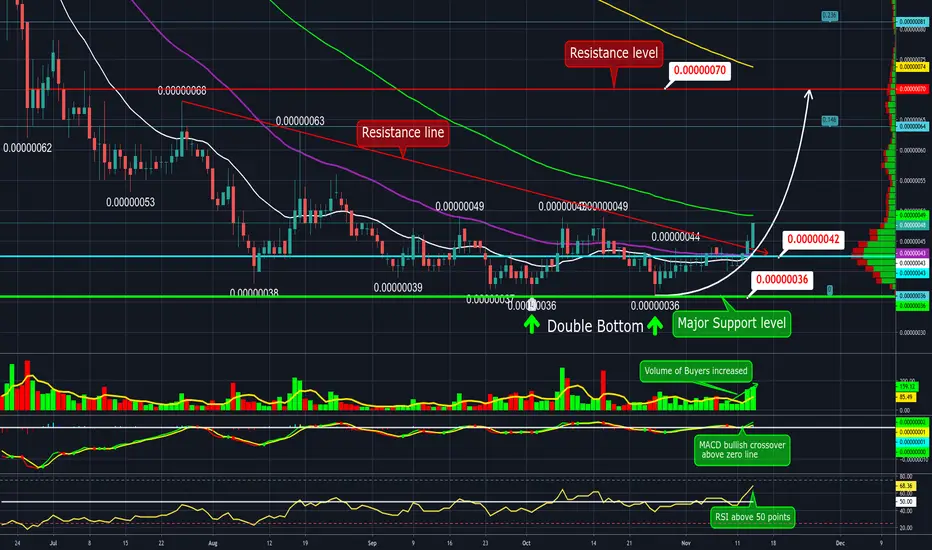
Verge price action above red resistance line breakout. Hodl above EMA 21,50 on daily TF. Testing EMA 100 which acting like resistance. Potential target 70 sats Resistance level.
Volume: of buyers increased.
Indicators: MACD bullish crossover above zero line. RSI above 50 points. Bullish sign.
Pattern: double bottom pattern at 36 sats.
S/R: Major Support 36 sats, Support 40 sats. Resistance 50 sats, Major Resistance 70 sats.
Disclaimer: THIS IS NOT FINANCIAL ADVICE. All the information shared here is for learning and entertainment purposes only.
Volume: of buyers increased.
Indicators: MACD bullish crossover above zero line. RSI above 50 points. Bullish sign.
Pattern: double bottom pattern at 36 sats.
S/R: Major Support 36 sats, Support 40 sats. Resistance 50 sats, Major Resistance 70 sats.
Disclaimer: THIS IS NOT FINANCIAL ADVICE. All the information shared here is for learning and entertainment purposes only.

Pernyataan Penyangkalan
Informasi dan publikasi ini tidak dimaksudkan, dan bukan merupakan, saran atau rekomendasi keuangan, investasi, trading, atau jenis lainnya yang diberikan atau didukung oleh TradingView. Baca selengkapnya di Ketentuan Penggunaan.
Pernyataan Penyangkalan
Informasi dan publikasi ini tidak dimaksudkan, dan bukan merupakan, saran atau rekomendasi keuangan, investasi, trading, atau jenis lainnya yang diberikan atau didukung oleh TradingView. Baca selengkapnya di Ketentuan Penggunaan.