
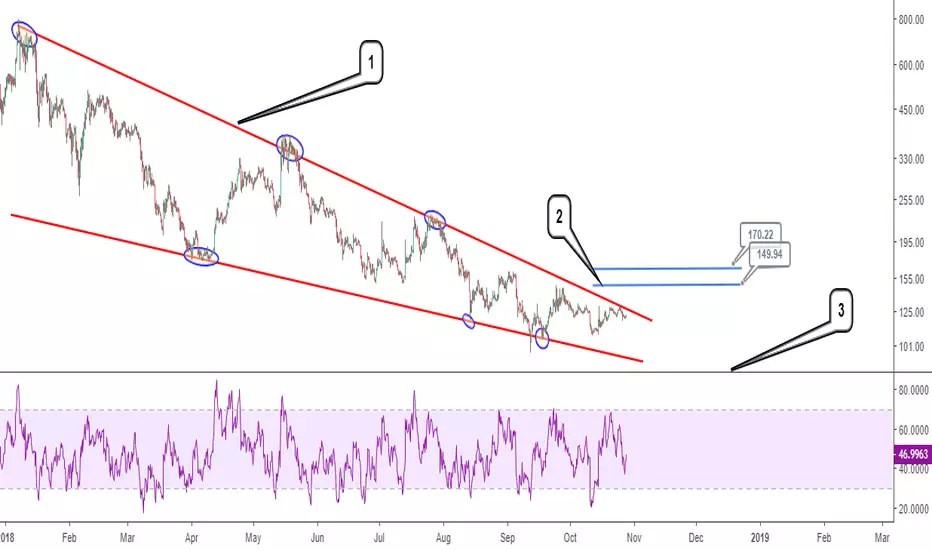
The 6 hour time frame of Zcash is shown in this analysis on a logarithmic scale with commentary provided based on the numbers marked on the chart.
(1) A falling wedge chart pattern is used to capture the entirety of price action from January 10, 2018 till date. The implication of the pattern is ideally bullish and suggests demand for Zcash eventually overwhelming supply.
(2) Immediate region of supply (resistance) that lies above the falling wedge. Range for this region is between ~$170.22 and $149.94. Price action closing to the upside of the almost 9 months old chart pattern, and especially above $170.22 does present a bullish bias in Zcash
(3) The relative strength index (RSI) shown here does negate immediate resumption of bullish momentum, and patience is therefore required.
(1) A falling wedge chart pattern is used to capture the entirety of price action from January 10, 2018 till date. The implication of the pattern is ideally bullish and suggests demand for Zcash eventually overwhelming supply.
(2) Immediate region of supply (resistance) that lies above the falling wedge. Range for this region is between ~$170.22 and $149.94. Price action closing to the upside of the almost 9 months old chart pattern, and especially above $170.22 does present a bullish bias in Zcash
(3) The relative strength index (RSI) shown here does negate immediate resumption of bullish momentum, and patience is therefore required.

Publikasi terkait
Pernyataan Penyangkalan
Informasi dan publikasi ini tidak dimaksudkan, dan bukan merupakan, saran atau rekomendasi keuangan, investasi, trading, atau jenis lainnya yang diberikan atau didukung oleh TradingView. Baca selengkapnya di Ketentuan Penggunaan.
Publikasi terkait
Pernyataan Penyangkalan
Informasi dan publikasi ini tidak dimaksudkan, dan bukan merupakan, saran atau rekomendasi keuangan, investasi, trading, atau jenis lainnya yang diberikan atau didukung oleh TradingView. Baca selengkapnya di Ketentuan Penggunaan.