
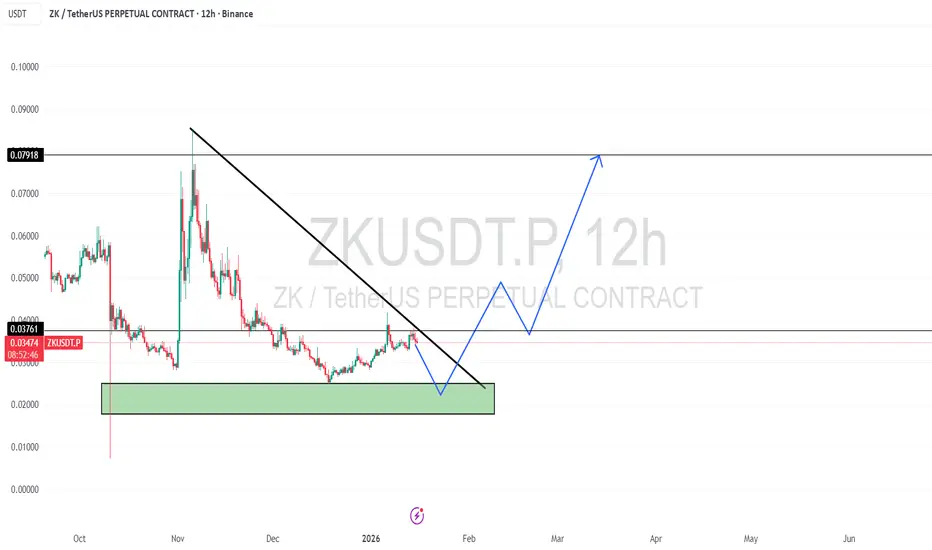
📌 $CFI:ZK Technical Analysis: The market has recently experienced a massive price dump, sliding from approximately $0.084 down to the $0.025 - $0.035 range. While the long-term trend remains weak, we are seeing signs of stabilization near historical lows.
📌 The Path to Bullish Confirmation: To see a sustainable move toward the upside, the following three technical conditions must be met:
Touch the Support Zone: The price needs to drop and interact with the primary Green Support Zone to find necessary liquidity.
Hold the Support: Buyers must step in and prevent the price from closing below this zone on the daily candle.
Breakout Trendline: A decisive breakout above the long-term descending trendline is required to shift the market structure from bearish to bullish.
📌 Indicator Check (1D Timeframe):
Relative Strength Index (RSI): Currently sitting in the neutral zone. This is healthy as it shows there is no immediate "overbought" pressure, leaving plenty of room for a price rally once a breakout occurs.
Moving Averages: The 50-day SMA is currently sloping upward and acting as a potential dynamic support. However, the 200-day SMA is still positioned above the current price, acting as a major long-term resistance that bulls need to reclaim.

Join My Free Signal Channel ➡ t.me/Leo524
Join For More Indicators ➡ t.me/leoindicators
Join For More Indicators ➡ t.me/leoindicators
Pernyataan Penyangkalan
Informasi dan publikasi ini tidak dimaksudkan, dan bukan merupakan, saran atau rekomendasi keuangan, investasi, trading, atau jenis lainnya yang diberikan atau didukung oleh TradingView. Baca selengkapnya di Ketentuan Penggunaan.
Join My Free Signal Channel ➡ t.me/Leo524
Join For More Indicators ➡ t.me/leoindicators
Join For More Indicators ➡ t.me/leoindicators
Pernyataan Penyangkalan
Informasi dan publikasi ini tidak dimaksudkan, dan bukan merupakan, saran atau rekomendasi keuangan, investasi, trading, atau jenis lainnya yang diberikan atau didukung oleh TradingView. Baca selengkapnya di Ketentuan Penggunaan.