LTCUSDT - A break above resistance will trigger a rally BINANCE:LTCUSDT is testing the resistance level of its trading range amid a local uptrend sentiment among crypto traders
Bitcoin is forming a local bullish trend, which is supporting the growth of altcoins. However, LTC is in a global bearish trend with two triggers ahead: 55.7, a breakout of which could trigger a rally toward the upper boundary of the global trading range, which is quite likely to hold back further growth.
Locally, the focus is on the current H1 range: 52.5 – 55.7. The market is forming its fourth attempt to retest resistance, which generally increases the chances of a breakout and further growth toward 56.6 – 57.3
Resistance levels: 55.7, 56.67, 57.37
Support levels: 55.24, 54.7
Before rising, the price may form a long squeeze in the 55.2–54.7 zone. However, a breakout and close above 55.7 could trigger a rally.
Best regards, R. Linda!  Long
Long
 Long
Long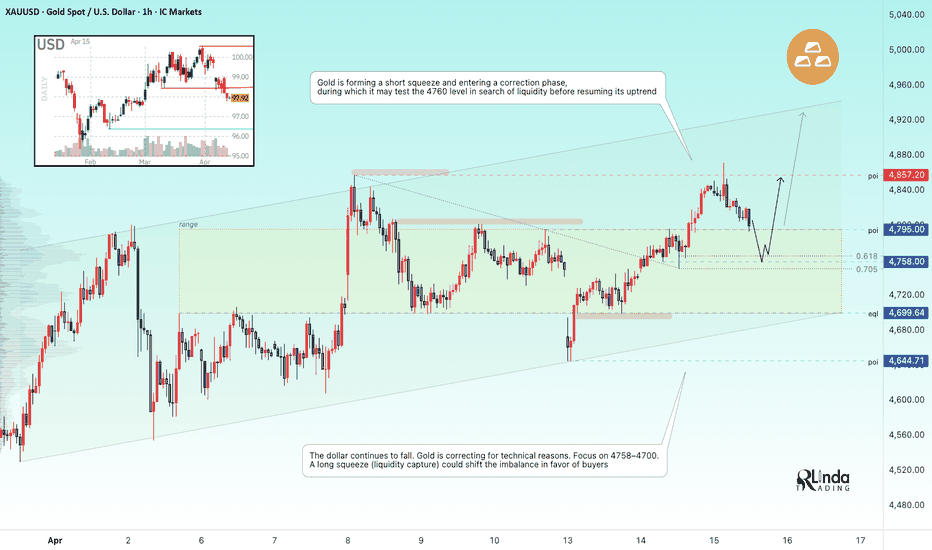
AUDUSD - Holding above 0.7100 could trigger a rally FX:AUDUSD is attempting to break through the consolidation resistance amid a weakening dollar due to geopolitical factors. The bullish trend may continue
The dollar is falling amid de-escalation in the Middle East. Markets are reversing, and the Australian dollar is strengthening.
Consolidation is forming against the backdrop of an uptrend. Compared to other pairs, this currency pair looks more poised to continue its upward movement. The price is breaking through resistance, and holding above the key level could trigger distribution
Resistance levels: 0.70950, 0.7143, 0.7168
Support levels: 0.7084, 0.7053
As part of the battle for resistance, a reversal pattern has formed, creating an intermediate bottom in the 0.7078 zone, confirming readiness for growth. Consolidation above 0.710 could support further growth toward 0.714
Best Regards, R. Linda! Long 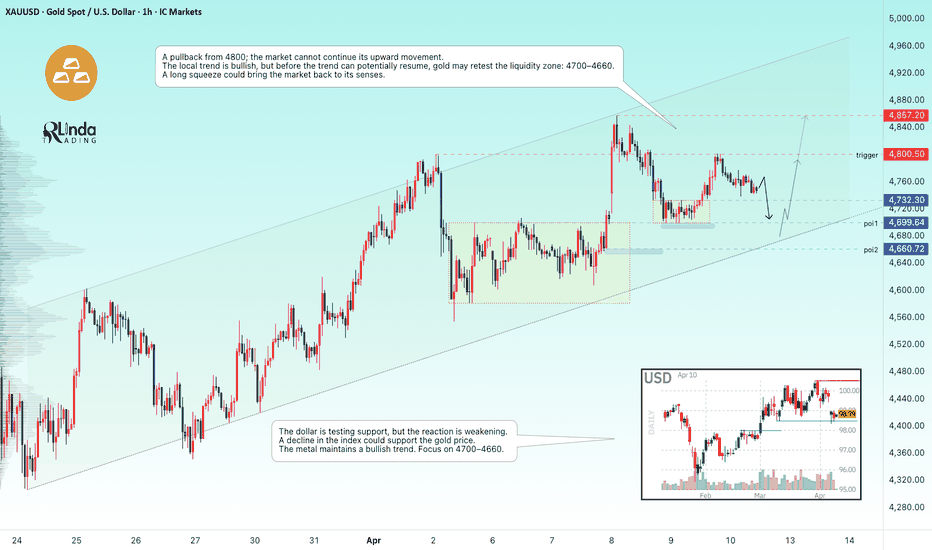
 Short
Short
Nifty Analysis EOD – April 8, 2026 – Wednesday🟢 Nifty Analysis EOD – April 8, 2026 – Wednesday 🔴
24,000 Gate: Bulls Coil in a Narrow Range After a 731-Point News Sprint.
🗞 Nifty Summary
Today was all about the news. Following the geopolitical tension relief this morning, Nifty flew up with a massive 731-point Gap Up.
The session started right around the March 18th swing high (23,862.25). In the first few minutes, the index added another 110 points. That previous swing high then flipped to act as support. Nifty reached 23,961, and during the pullback, it found solid support at the Fib 0.618 level. Another rally took the index to the 24,000 psychological level, which acted as a heavy resistance all day. Meanwhile, every dip was caught by that same Fib 0.618 support. Refer to the charts for the price action details.
After many attempts to cross 24,000, Nifty finally closed at 24,010.60, almost at the high of the day.
While the day was purely driven by war-front relief, it’s worth noting that the intraday volatility was very low after the gap. The IB Range was only 132 points and the total range was 196.65 points. Compared to my Gladiator Indicator range of 530 points, today’s movement was less than half of what’s expected. This is actually the smallest range day we’ve seen since February 26th.
On the 5-minute chart, Nifty is forming an Ascending Triangle pattern. Usually, this pattern has a 63 ~ 77 % probability of an upward breakout. If that breakout happens, there is a 72 ~ 83 % chance of hitting the projected target. Based on this, I am looking at an expectation of 24,160 ~ 24,200.
🛡 5 Min Intraday Chart with Levels
📉 Daily Time Frame Chart with Intraday Levels
🕯 Daily Candle Breakdown
Open: 23,855.15
High: 24,025.15
Low: 23,828.50
Close: 23,997.35
Change: +873.70 (+3.78%)
🏗️ Structure Breakdown
Type: Strong Bullish Candle (Gap & Hold).
Range: ≈ 197 points — narrow range considering the massive opening jump.
Body: ≈ 142 points — shows solid buying strength.
Upper Wick: ≈ 28 points — shows slight resistance near the 24,025 peak.
Lower Wick: ≈ 27 points — shows minor dip-buying support near the open.
🛡 5 Min Intraday Chart
⚔️ Gladiator Strategy Update
ATR: 530.58
IB Range: 132.75 → Small
Market Structure: UnBalanced
Trade Highlights:
11:26 Short Trade: Trailing Target Hit (R:R 1:0.71)
12:32 Short Trade: SL Hit
14:42 Long Trade: SL Hit
Trade Summary: Today was a bit frustrating for my execution. I managed a small win on a trailing short early on, but the afternoon chop resulted in two stop-losses.
🧱 Support & Resistance Levels
Resistance Zones: 24,160 | 24,225 ~ 24,280 | 24,360 | 24,444
Support Zones: 23,830 | 23,580 | 23,455
🧠 Final Thoughts
“The tighter the coil, the stronger the eventual spring.”
For tomorrow, I am expecting a Range Expansion Day.
If Nifty starts above 24,000 (which seems likely), then 24,225 ~ 24,280 will be the first line of resistance. On the downside, the major support at 23,450 is quite far away, so I will be watching the 23,820 level very closely for any signs of risk.
Let’s see if the bulls can clear the gate.
✏️ Disclaimer
This is my personal digital diary and represents my own analysis and point of view. It is not financial advice; please consult a professional advisor before making any trading decisions. BITCOIN - 72K Retest: Are We Poised for Growth?BINANCE:BTCUSDT.P is rallying from $67,700 due to a local shift in the fundamental landscape in the Middle East. The flagship cryptocurrency is testing $72,000
The de-escalation of the conflict and the temporary pause have had a positive impact on the S&P 500 and Nasdaq indices, which in turn has affected the cryptocurrency market, making them more attractive amid falling oil prices and a weakening dollar
Bitcoin is testing 72K; Tuesday’s session is closing fairly close to this level, and the price’s reluctance to decline signals potential upside momentum. If consolidation continues, this will be a positive sign for a possible breakout above 72K. A close above this level could trigger a rally toward 74K–75K
Resistance levels: 72,000, 74,000
Support levels: 71,200, 70,250
However, it cannot be ruled out that the market may form a correction (due to liquidity) with the aim of closing the imbalance zone and testing the 70,253 support level before rising.
Best regards, R. Linda!  Long
Long
GOLD - Consolidation amid a bullish trend. Trigger at 4700 ICMARKETS:XAUUSD is consolidating above 4,600 as part of a local uptrend. The dollar is in a correction, and the market is picking up on subtle hints of potential negotiations regarding the Middle East...
There are hints of potential negotiations; Trump may withdraw his ultimatum. If this is confirmed, the market may react positively.
The dollar has been in a correction for two days, which is supporting the metal’s price. Focus on the local range of 4601–4700. Gold is retesting resistance (trigger) at 4700; the reaction is important to me. If there is no pullback and the market holds near this zone, a break above 4700 could trigger further growth toward 4800.
Resistance levels: 4700, 4793, 4800
Support levels: 4650, 4600, 4555
Further growth depends on geopolitics. A retest of 4600 before a rally cannot be ruled out, as a large liquidity pool has formed below 4600
Best Regards, R. Linda! Long 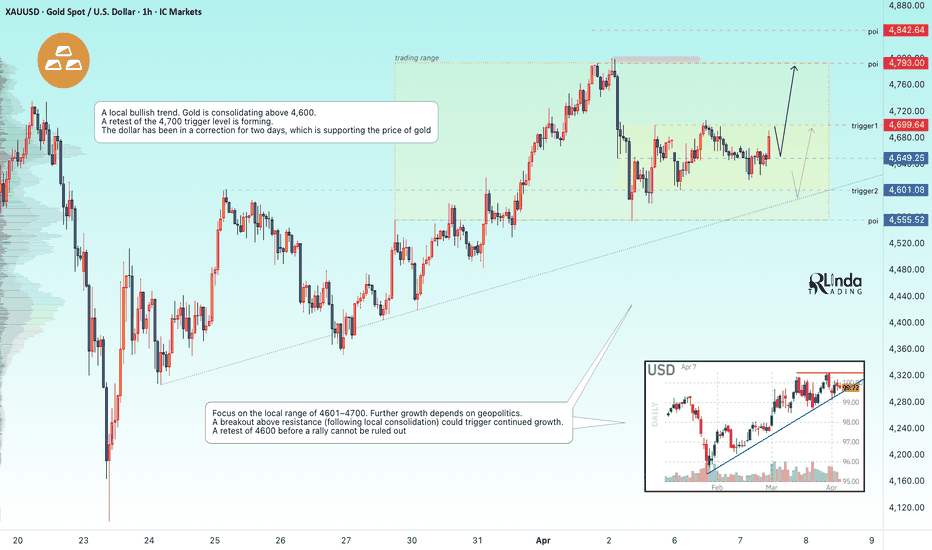
GOLD - Price within a range, retesting resistance...ICMARKETS:XAUUSD ended last week on a mixed note, with half of the sharp decline recovered. The fundamental backdrop is complex; technically, there are bearish indicators.
On Friday, NFP data (+178K instead of -133K) and unemployment figures (4.3% instead of 4.4%) were released. The dollar closed the week on a generally positive note. Oil will continue to rise. Regarding economic data, it can be said that gold is under pressure.
Geopolitics: The situation in the Middle East is not going according to Trump’s plan. The Strait of Hormuz remains closed, and oil prices are rising. There are hints of a closure of the Bab el-Mandeb Strait, which would only accelerate the rise in oil prices; this would lead to a rise in the dollar, higher inflation, and pressure on metals.
Technically, gold could bounce off the nearest resistance zone to 4580–4550, but if the market maintains its local bullish trend, the price could test the 4842 zone of interest. However...
Resistance levels: 4700, 4735, 4793
Support levels: 4580, 4555, 4479
However, the markets were closed for three days; during this time, much was said and done, which could generally impact the situation. There is a possibility of a gap opening, but we will need to monitor the Asian and European sessions.
Best regards, R. Linda! GOLD - Trend Breakdown and countertrend correction ICMARKETS:XAUUSD made a sharp reversal and pullback from its two-week high of 4,800 and shifted to heavy selling following Trump’s tough remarks on Iran. The escalation continues. The dollar and oil are rising....
Trump continues to manipulate the situation, but not very successfully. Iran has rejected a request for a ceasefire, insisting on its own plans. The UAE is lobbying for a military operation to open the Strait of Hormuz through the UN Security Council → risk of conflict escalation.
The dollar is strengthening as a global reserve currency. Expensive oil is fueling inflation expectations. The market is pricing in a Fed rate hike.
The fundamental backdrop remains bearish for gold. Any rebound will likely be used as an opportunity to sell. The market is awaiting NFP data, but the main driver remains the development of the conflict
Resistance levels: 4651, 4677, 4713
Support levels: 4553, 4529
Technically, a counter-trend correction is forming. If bears keep the price below the key resistance zone of 4677–4651, this could intensify the sell-off amid a rising dollar. Gold is under pressure. Zone of interest: 4530–4430
Best regards, R. Linda! Short 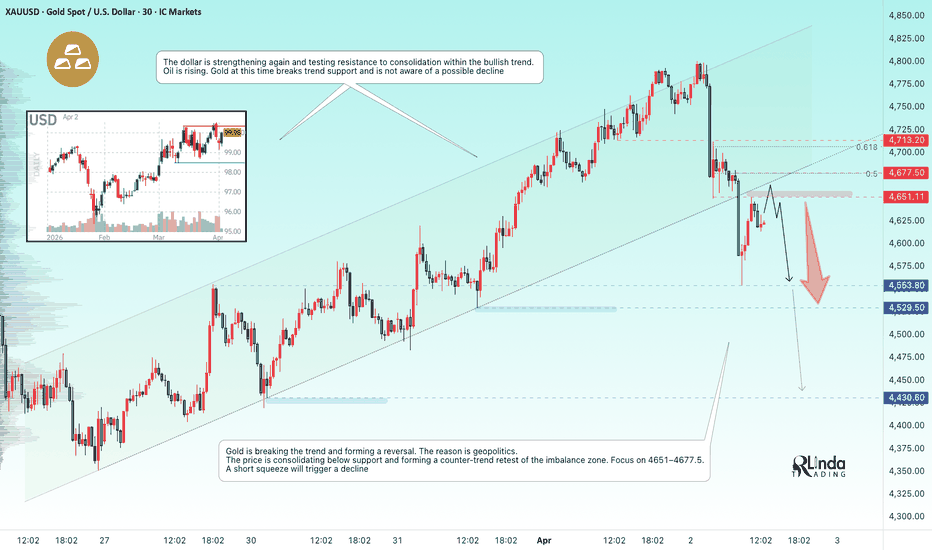
GOLD - Consolidation near the trigger. Uptrend and newsFX:XAUUSD is trading near key resistance at 4,735, finding support from a weaker dollar amid hopes for a de-escalation of the conflict in the Middle East
Key factors: Trump did not anticipate this turn of events in the Middle East, shifting responsibility for the strait to NATO countries. Earlier this week, the president stated that he was ready to end the war even without opening the strait.
A lot of economic news is expected today.
ADP Employment Change – a reading below the forecast will increase pressure on the dollar and lower expectations for a Fed rate hike.
The main event of the week: Nonfarm Payrolls (NFP) on Friday (Good Friday).
Risk appetite has reduced demand for the dollar as a safe haven, which has supported gold.
Gold is recouping its March losses amid a combination of geopolitical optimism and weak signals from the U.S. labor market. Holding above $4,700 will pave the way for further recovery
Resistance levels: 4735, 4866
Support levels: 4683, 4600
The false breakout of resistance elicited virtually no reaction (drop). Gold is consolidating near this level. If, during this consolidation, the market manages to break through 4735 and close above that level, the market will have an opportunity to rally. Otherwise, a retest of 4600 is possible amid news-driven volatility.
Best regards, R. Linda! Long 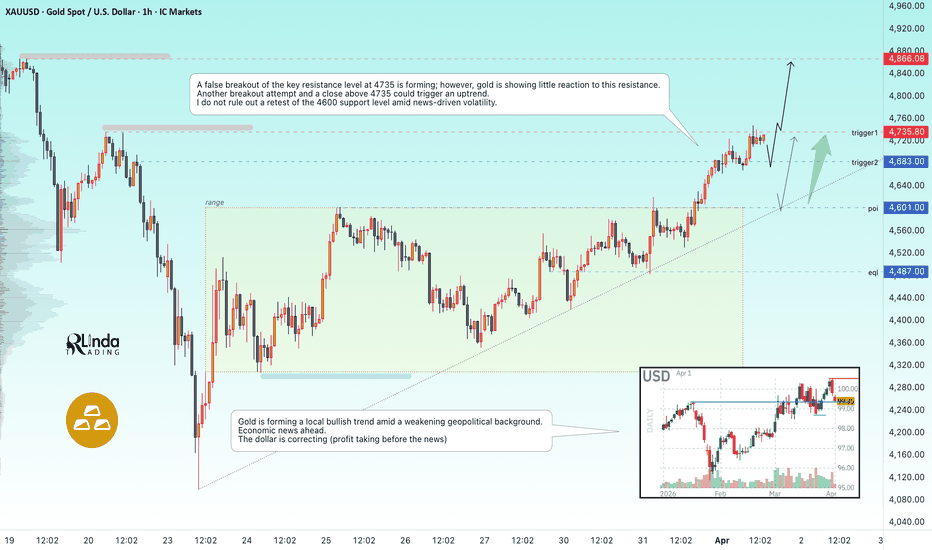
GOLD - Mixed fundamental data. Range: 4550 – 4600 ICMARKETS:XAUUSD is testing the 4,600 level within a local uptrend and forming a short squeeze. The market is under pressure from a global downtrend, a strong dollar, and high oil prices...
During his speech yesterday, Powell stated that long-term inflation expectations in the U.S. remain under control. However, it can be assumed that high oil prices will have an extremely negative impact on inflation and the markets...
Reports of a possible winding down of the U.S. military campaign against Iran have eased tensions, but Iran is not ready for direct negotiations, and the U.S. continues to strengthen its military presence in the region, which maintains uncertainty
Technically, the focus is on the local range of 4600–4550. A breakout above resistance could open the door for a rise to 4675–4735. A break below the 4550 support level would put the trend line at risk and signal a possible decline to 4400–4350
Resistance levels: 4601, 4735
Support levels: 4550, 4487, 4416
Technically, following a false short squeeze at 4600, a situation is forming on the chart that could lead to a sell-off. Trigger: 4550. A close below this level could trigger a sell-off to 4887; a close below 4887 would open the way to 4416. However, the structure will be broken if the market consolidates above 4600–4620.
Best regards, R. Linda! Short 
HYPEUSDT - Consolidation above key support$BINANCE:HYPEUSD.P has been in a bullish trend since late January, indicating the presence of interested buyers in this altcoin. As part of a correction, the price is retesting the 37.0 support level, but at the same time, it is poised for an uptrend
Bitcoin is under pressure from a downtrend but is forming a rebound from 67K, thereby supporting the altcoin market. HYPE looks strong compared to other altcoins, maintaining a local trend over the past few weeks.
HYPE is testing trend support, forming an intermediate bottom and a rebound. If the bulls keep the asset above 36.7–38.3, the price may find support for further growth toward 43.75
Resistance levels: 40.5, 43.75
Support levels: 38.35, 36.77, 35. 88
Consolidation above the key support zone will confirm the bullish market’s intentions. The medium-term outlook is favorable, and growth could be directed toward 43.75–50.0
Best regards, R. Linda!  Long
Long
BITCOIN - A hunt for liquidity ahead of a drop to $69000BINANCE:BTCUSDT.P was unable to sustain the previous week’s gains and, following weak economic data, entered a distribution phase from 74,000, testing an intermediate low of 69K. A correction is taking shape...
The global trend is bearish, with pressure on the market coming from weak U.S. indices and the Fed’s hawkish stance. Bitcoin has failed to confirm its status as a safe-haven asset amid the current tense geopolitical situation.
After the sell-off, the price is finding support in the 69,100 zone, confirming the local trend line and forming an additional area of liquidity to which the market may still return
A local rebound and correction toward the 72,400 zone are forming. A short squeeze and bears holding the key zone could trigger a move toward the 69,100 support level.
Resistance levels: 71,750, 72,400
Support levels: 70,220, 69,100
As part of the correction, the price may test the 71,750–72,400 imbalance zone, while a liquidity squeeze and a false breakout could trigger another sell-off and a drop toward the key support level of 69,100
Sincerely, R. Linda! Short 
USDJPY - Long squeeze before the trend continues FX:USDJPY is testing the key level of 159.19 as part of a counter-trend correction. A long squeeze could trigger an upward rally.
The dollar is testing its highs and poised to continue its rise following yesterday’s news.
The Fed kept rates unchanged, hinting at maintaining the current rate in the medium term amid high inflation. Against the backdrop of a strong DXY, the Japanese yen may continue to weaken. However, as Japan’s national currency weakens, the risk of intervention by the Bank of Japan is growing.
The currency pair is forming a trading range of 158.6–159.8. The trend is bullish, the dollar is strong, and the probability of the uptrend continuing after the long squeeze is quite high.
If the bulls hold the 159.2–159.0 area, the price will have strong support for an upward move.
Resistance levels: 159.75, 159.85
Support levels: 159.19, 159. 0
A long squeeze (false support breakout) and consolidation above 159.19 could support further growth
Sincerely, R. Linda!  Long
Long
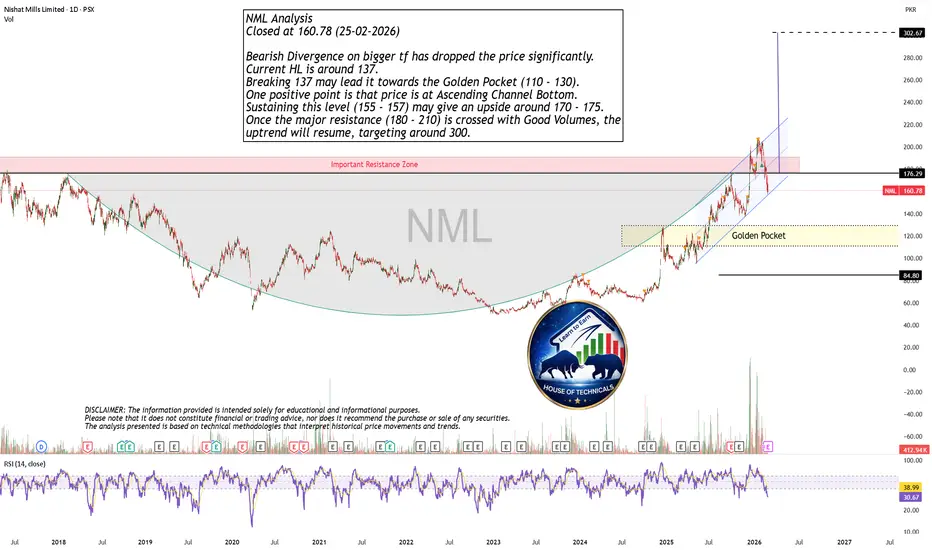
MCX – STWP Equity Snapshot📊 MCX – STWP Equity Snapshot
Ticker: NSE: MCX
Sector: Financial Market Infrastructure / Exchange
CMP: 2,671.80 ▲ (+4.55%)
Learning Rating: ⭐⭐⭐⭐☆ (Breakout Attempt Near Supply)
Chart Pattern Observed: Ascending Triangle Testing Resistance
Candlestick Context: Strong Bullish Expansion Toward Supply Zone
MCX has been steadily transitioning into a constructive structure after forming a higher low near the 1,950 region and gradually building an ascending price pattern. The recent price action reflects a strong bullish expansion, with price now approaching a well-defined resistance zone near the 2,680–2,700 band. This area has previously acted as a supply region, making it a critical decision zone for the next phase of price behaviour.
The structure now reflects a developing uptrend, supported by higher lows and consistent buying pressure on dips. The most recent move shows strength, but it is also testing an important resistance cluster, where market behaviour typically shifts between continuation and rejection.
From a momentum standpoint, RSI is positioned around 65.6, indicating strong bullish momentum without yet entering extreme overbought territory. This supports continuation potential, but also suggests that price is approaching a zone where short-term reactions or pauses can occur, especially near resistance.
Volume participation is moderately above average, with relative volume near 1.46 times the normal activity band. This indicates healthy participation supporting the move, though not yet at levels typically associated with aggressive institutional breakout confirmation. For continuation, further expansion in volume near resistance would be a positive signal.
From a demand–supply perspective, a well-defined demand zone is positioned between 2,478 and 2,440, which aligns with the recent higher low structure. This zone acts as a key structural support area, and its integrity is important for maintaining the current bullish framework.
Volume Analysis
Current participation reflects moderate expansion, with relative volume near 1.46 times average levels. This suggests steady but not aggressive accumulation. If volume expands further as price attempts to move above resistance, it would improve the probability of breakout acceptance. Without such expansion, the move may transition into consolidation near current levels.
Key Levels – Daily Timeframe
Primary support is positioned near 2,600, followed by the broader demand zone between 2,478 and 2,440. These levels represent key structural areas where buyers have previously shown interest.
On the upside, immediate resistance lies near 2,700, followed by higher supply zones around 2,751 and 2,822. These levels are critical for confirming continuation beyond the current range.
Structure Read – What Matters Now
The most important observation is that price is testing a major resistance zone after a steady higher low formation. This creates a classic decision point:
If price sustains above 2,700, it may trigger continuation toward higher resistance levels.
If price fails to hold above this zone, a pullback toward the 2,600–2,480 demand area becomes likely.
The structure currently supports a bullish bias, but confirmation depends on acceptance above resistance, not just a temporary breakout.
Price Reference Framework – Educational View
From an intraday perspective, the observation zone lies around 2,681, with risk invalidation below 2,565. Upside reaction zones are positioned near 2,796 and 2,912, where price may encounter resistance.
From a swing perspective over the next two to five sessions, the observation zone remains near 2,681, while structural invalidation lies below 2,478. If the breakout sustains, higher reference zones extend toward 3,086 and 3,391.
STWP Option Chain Analysis (EOD 17 Mar 2026)
From the current options positioning for the 30 March expiry, an important support base is visible near 2,600, while resistance is concentrated around 2,700. The highest liquidity is clustered near 2,680, which may act as a short-term price magnet.
Call-side positioning is building around 2,700, while put-side liquidity remains visible near 2,600. Another notable level is 2,740, where price may face additional hedging-driven resistance.
The visible positioning band currently spans approximately 2,600 to 2,700, creating a range width of about 100 points. Based on this structure, the expected intraday movement is approximately ±40 points from the ATM zone, placing upper activity near 2,720 and lower activity near 2,640.
Options pressure currently reflects stronger put-side positioning, suggesting supportive conditions beneath current price levels. The build-up signal indicates short build-up, which may create resistance pressure near higher levels.
Key liquidity strikes include:
Best CE Liquidity Strike: 2,700
Best PE Liquidity Strike: 2,660
No significant liquidity vacuum is currently observed.
If price manages to move above 2,800, it may signal strengthening bullish momentum. Conversely, a move below 2,500 may increase downside pressure.
Overall, the options structure suggests range-bound behaviour between 2,600 and 2,700, with 2,680 acting as a liquidity magnet as participants continue adjusting positions.
STWP View
Momentum is strong while the broader trend is transitioning into an uptrend structure. Risk remains elevated due to proximity to resistance. Volume is moderately supportive, and sentiment remains bullish with the session registering a gain of approximately 4.55 percent.
Final Outlook
Momentum: Strong
Trend: Up
Risk: High
Volume: Moderate
📘 Learning Note
Breakouts near resistance zones should always be validated through acceptance and participation. A strong structure builds confidence, but only sustained price action above supply confirms continuation. Without confirmation, resistance zones often lead to consolidation or pullback.
⚠️ Disclaimer
This post is intended solely for educational and informational purposes. It does not constitute investment advice, a recommendation, or a solicitation to buy or sell any security. Market investments are subject to risk. Please consult a SEBI-registered financial advisor before making any investment decisions. STWP is not responsible for actions taken based on this analysis.  Long
Long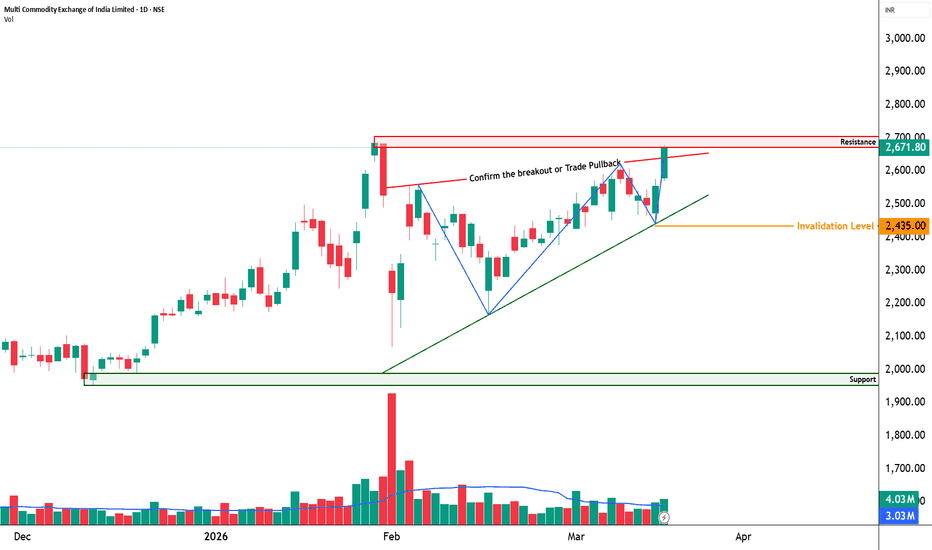

 Long
Long