US CPI Takes Center Stage as Markets Brace for Higher VolatilityMorning traders! The market remains relatively slow, but volatility could pick up today as US CPI inflation data takes center stage.
Oil extended its rally as the US and Iran appeared to harden their positions over negotiations involving the Strait of Hormuz, despite Pakistan's defense minister saying the two sides are close to reaching an agreement. Higher oil prices are keeping investors cautious as markets weigh geopolitical risks against uncertainty over the Federal Reserve's next rate mov
Bearish Patterns
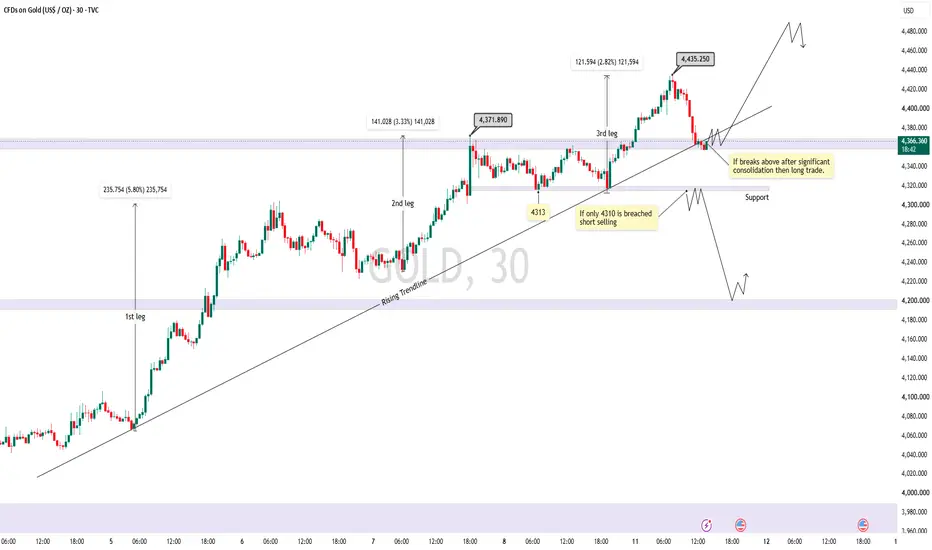
Has gold peaked already, decline to continue?After yesterday's up move price had retested an important resistance of 4435 and has retraced form there, currently taking support of 4371 (immediate resistance) which is at the vicinity of rising trendline, which may result into additional bullish pressure.
If you zoomed-out a bit you'll see each consecutive up-moves after the corrections in this uptrend is continuously declining, which signals weakening of the trend and may show some deeper correction. We should be actively looking for some s
AUDUSD Will Fall! Sell!
Take a look at our analysis for AUDUSD.
Time Frame: 4h
Current Trend: Bearish
Sentiment: Overbought (based on 7-period RSI)
Forecast: Bearish
The market is testing a major horizontal structure 0.705.
Taking into consideration the structure & trend analysis, I believe that the market will reach 0.701 level soon.
P.S
The term oversold refers to a condition where an asset has traded lower in price and has the potential for a price bounce.
Overbought refers to market scenarios where the instr
GBPJPY – Bears Waiting at ResistanceGBPJPY is currently retesting a strong resistance and supply zone around 215.50–216.50, an area that has played an important role in the past.
After the recent bearish impulse, price recovered sharply and is now approaching this key zone from below.
📌 As long as the resistance zone holds, we will be looking for sell setups.
However, resistance alone is not enough.
For the bears to take over and confirm the next bearish impulse, we need to see a clear break below the rising red trendline.
Un
Decentraland Tests Support, Lower Next ?Decentraland (MANA) remains under significant bearish pressure as price continues to trade within a well-defined descending channel.
The broader market structure remains negative, with sellers maintaining control through a series of lower highs and lower lows. While the current daily support is still holding, it is beginning to show signs of weakness, making this a critical area to monitor in the coming sessions.
The immediate focus is on the current weak low. If price sweeps this level and r
PEPE Faces Rejection, Lower Incomming ? PEPE is approaching a critical technical decision point as price trades into a major resistance zone backed by multiple layers of confluence.
The current resistance aligns with the 0.618 Fibonacci retracement, while the Value Area High (VAH) of the current trading range sits in the same region. This combination creates a high-probability area where sellers may begin to regain control and slow the recent bullish momentum.
At present, the market is testing whether buyers have enough strength to
Pump Must pay the PriceHello Traders!
Recently we got hit the stoploss but this the formation is complete. It is ready to fall hard. Pump will pay the price for extra rise.
We are shorting Pump from 0.0028
Stoploss 0.002991 (-6.5%)
Target 0.001982 (+29.2%)
My goal is to be recognized as one of the highest win-rate traders in the TradingView community. :)
Trade Analysis Based on
> Fibonacci Tool (A1000x Way) – Custom Fibonacci approach for precise market analysis
> Candlestick Patterns – Strong price action conf
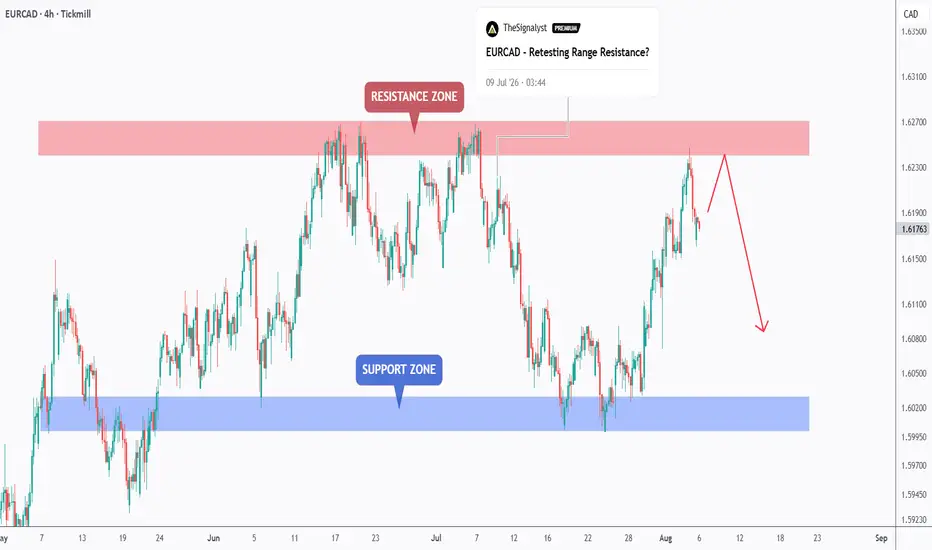
EURCAD - Trading The Range!EURCAD has been trading within a large range, with price repeatedly rotating between well-defined support and resistance levels. 📊
📌 Price is now retesting the upper bound of the range, where a major resistance zone comes into focus. As long as this resistance continues to hold, we will be looking for sell setups in anticipation of another move back toward the lower boundary of the range.
This area has repeatedly attracted sellers in the past, making it a high-probability zone to monitor. Rath
XRP Bears Remain In Control XRP continues to trade within a well-defined bearish market structure, remaining below the key weekly resistance level at $1.40. This level has become the most important barrier for buyers, as every attempt to recover has so far failed to reclaim it.
Until price can close decisively above this resistance, the broader trend remains tilted to the downside.
The current technical structure continues to produce lower highs and lower lows, indicating that sellers remain in control of the market. Whil
Employment Data "Tipped The Cup" on USD/CADToday, Employment Data was released for both USD and CAD and the results showed themselves as a Breakout of an Inverse Cup and Handle Pattern on the Daily, lets break it down!
OANDA:USDCAD was finding Support in the 1.4000 area and with the 23K job loss for USD and almost 60K job increase for CAD, we can see price finally broke down through this Support Zone, confirming the Cup and Handle Pattern.
- This will put the Federal Reserve in a position to Hold rates longer instead of a Hike.
Now w
EURJPY Pullback reversal, continued down-move to follow!This up trending move is basically the pullback which came after the huge bearish candles that we saw forming on 30 July - 3 Aug, which has broken below some of the most significant supports. This up-move is kind of topped out at the presence of 0.382 fib retracement level.
This up-move itself seems like loosing the flair and had also given a breakout below 182.098, immediate resistance is at 182.694. we are expecting a continued down form here and price is expected to form newer low than previ
USDollar In A Corrective Recovery Ahead of NFP Before WeaknessGood morning, traders!
The U.S. Dollar Index ( TVC:DXY ) is recovering on an intraday basis after recent weakness, and the current structure suggests that further upside could still unfold in the short term. Ideally, the ongoing recovery could develop as wave (c) of an (a)(b)(c) correction within wave "iv".
If this scenario plays out, the dollar could retest the 100.0 psychological resistance level before the corrective recovery is completed and the broader downside resumes within wave "v". The
USDJPY:BoJ Intervention Triggers Sell-Off As Correction DevelopsUSDJPY has finally turned sharply to the downside, likely following BoJ intervention. We have seen a strong decline from the 164 area, and because this move unfolded aggressively within a very short period of time, we assume that an important top is already in place.
This view was confirmed after price broke below the trendline support extending from the triangle pattern and, more importantly, below the 162.65 support level. The market is now stabilizing and recovering from the 155 area, sugges
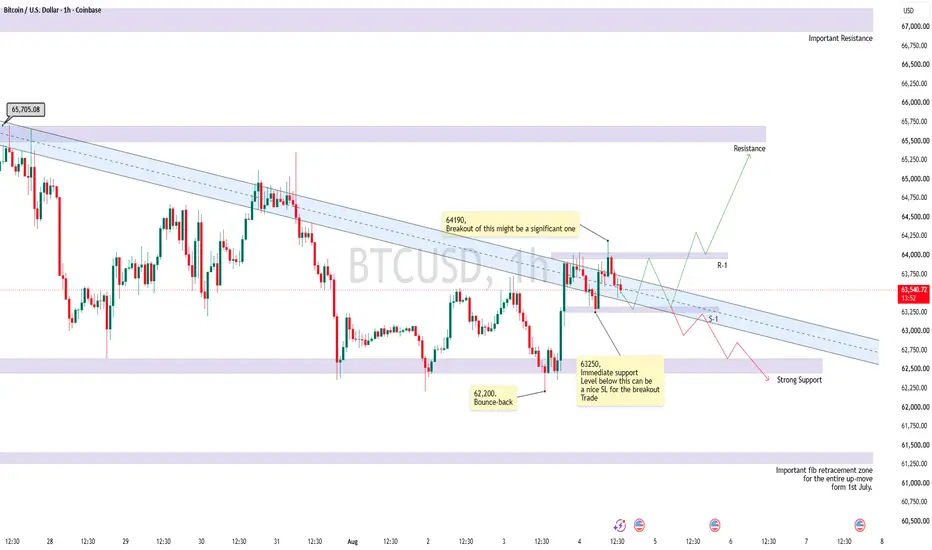
Bitcoin Outlook, Setup and important levels for today!After consolidating below the bearish trendline trying to give breakout above it, and seriously threatening the bearish structure, currently consolidating above the trendline, 64190 is immediate resistance and 63250 is immediate support, expected to continue its consolidation and then give breakout above the R-1 64190, upon breakout we can initiate Long entries with Stoploss of 63250.
however since BTC is at a junction where we cannot even rule-out the possibilities of bearish moves as well. so
NZDJPY - Range Resistance Back in FocusNZDJPY has been trading within a broad range, with price repeatedly reacting to its upper and lower boundaries. 📊
Price is now approaching the upper bound of the range, where a strong resistance zone has rejected buyers on multiple occasions.
📌 As long as this resistance zone continues to hold, we will be looking for short setups, anticipating another move back toward the lower half of the range.
As always, rather than selling blindly into resistance, we will wait for bearish confirmation bef
Everyone Is Talking About a Crash Chart Is Finally Showing CRACK
Over the past few weeks, market crash discussions have become increasingly common.
From a technical perspective, QQQ (Nasdaq) is finally beginning to show what I would consider the first meaningful signs of weakness after an extended advance.
That doesn't automatically make me bearish.
My current view is that the market appears overextended based on my study of price action. At the same time, I see no reason to assume the uptrend is over simply because signs of weakness have started to app
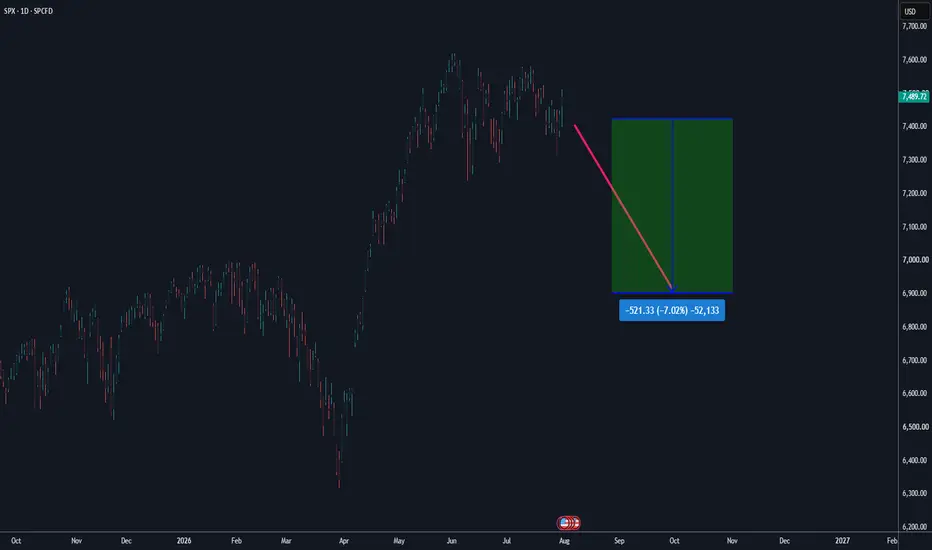
SPX Bearish Setup / Correction OutlookLooking closely at the daily chart for SPX, we are seeing signs of momentum slowing down after a powerful rally to the upside.
The Setup: Price action is currently consolidating near recent highs, forming a potential top.
The Projection: A downward correction wave is mapped out, targeting a move towards the 6,900 support zone.
Key Metrics: This points to an anticipated downside move of roughly -521.33 points (-7.02%).
Watch key support levels closely as price approaches this projected target
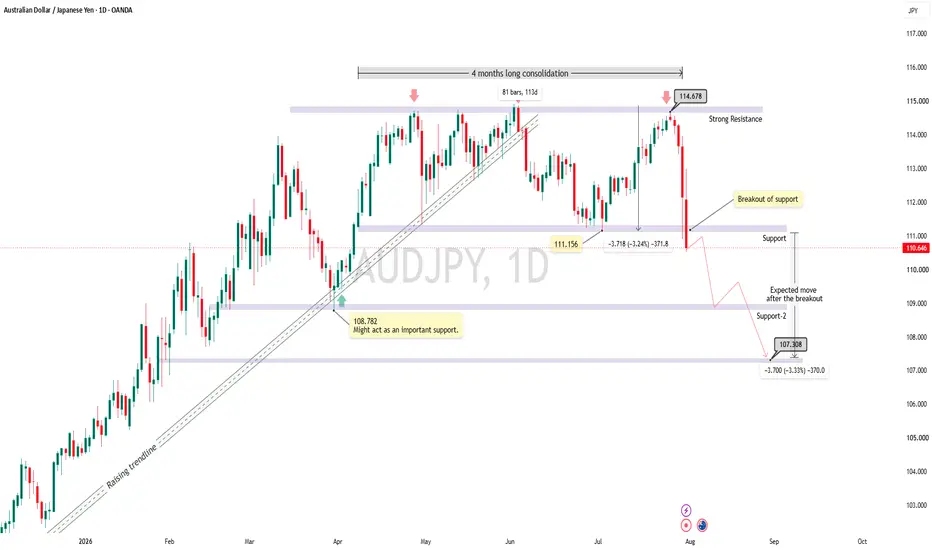
AUDJPY bearish reversal confirmed ??The up-swing that started on April 2025, seems to have came to an end as price has already breached the rising trendline along with breaking below 111.156 which was an important support for the consolidation that price had made in past 4 months, we can consider this as a topping formation.
structurally the stance has definitely shifted form bullish - sideways to bearish direction, now in my opinion taking shorts on pullbacks would be the right thing to do. for the consolidation & topping forma
XRPUSD - Rank S Crypto to ShortI'm gonna tilt more than one maybe but right now ultra compressed candles 1h & 4H on a retest of a broken trendline
volume says a lot
Waterfall soon ? based on BTC behavior u can count on 22 days at least of dump
I dont have precise targets for now except the ultimate one : 0.7
purple lines on left were potential targets for this move up
My shorts are open from 1.39 to 1.46
invalid if 4H close above that line or new HH somehow will update
Cheers
Ethereum Appraoches Resistance Ethereum continues to trade within a constructive market structure, characterised by consecutive higher highs and higher lows that suggest buyers remain in control.
This sequence reflects a healthy bullish trend and indicates that demand has consistently stepped in following each pullback. However, price is now approaching a significant higher timeframe resistance zone that could determine the next major move.
The resistance region is reinforced by the Point of Control (POC) and a long-term V
Bearishness is what I'm "banking" on...Hello Traders!
600 handles delivered in NQ, just as expected and told beforehand in the TradingView posts.
I believe the bearish move is far from over . My current expectation is for at least another 1,000 handles lower. The immediate target is the set of daily wicks marked in cyan. That is the minimum objective I expect. There is also an open weekly gap, which I haven't marked on the chart purely for aesthetic reasons.
The only real question is the narrative.
My best guess is that th
XAU/USD 1H Trade Signal & Key Scenarios📍 Pair: XAU/USD (15m/1H Chart)
📊 Current Price: ~4,028.80 (Consolidating inside wedge)
🟢 Bullish Breakout Level: Above ~4,040.00 Trendline
🔴 Bearish Breakdown Level: Below ~4,000.00 Support
🎯 Scenario A: Bullish Breakout (Above ~4,040)
Trigger: A strong 1H candle close above the upper descending trendline (~4,040 region).
Technical Reason: Validates a structural breakout out of the compression wedge, shifting lower-timeframe momentum back to the bulls and targeting
Gold — Silence Before the Next Big Move
🏆Gold has entered a phase where movement has slowed, but that doesn't mean opportunity has disappeared. After recovering from the lower demand zone, price is now stabilizing inside a broad liquidity range, showing that both buyers and sellers are waiting for fresh confirmation before making their next aggressive move.
This kind of consolidation often acts like a spring—the longer price compresses, the stronger the eventual release can become.
📈 Bullish scenario
If buyers can reclaim the upp