GOLD — Target 4150 reached. What now?
The 4150 target from the Jun 10 post was reached today. Price dropped from 4268 support break directly to 4153 with no meaningful bounce.
Two scenarios from here:
Scenario A — Bounce: Price holds 4150, prints a bullish reversal candle on H4. Countertrend move possible toward 4268 (former support, now resistance). Not a trend reversal — just a relief bounce.
Scenario B — Continuation: No hold at 4150, price breaks lower. Next area of interest is 4100, then open air below.
Bias: Still bearish. No reason to buy until structure changes. 4268 remains the key level — only a close above it shifts the picture.
Watching.
Bearish Patterns
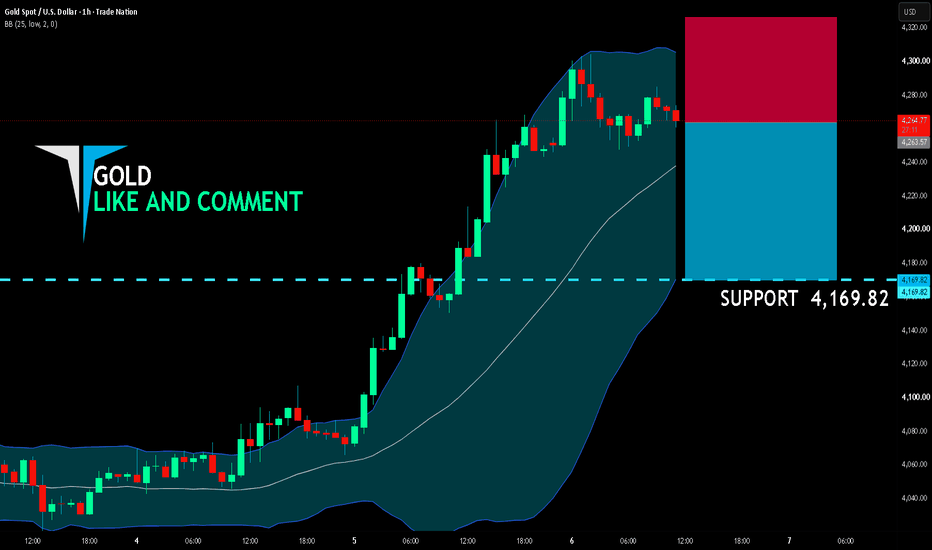
GOLD BEST PLACE TO SELL FROM|SHORT
GOLD SIGNAL
Trade Direction: short
Entry Level: 4,329.56
Target Level: 4,240.40
Stop Loss: 4,388.87
RISK PROFILE
Risk level: medium
Suggested risk: 1%
Timeframe: 1h
Disclosure: I am part of Trade Nation's Influencer program and receive a monthly fee for using their TradingView charts in my analysis.
✅LIKE AND COMMENT MY IDEAS✅
AUD/CHF BULLISH BIAS RIGHT NOW| LONG
Hello, Friends!
AUD/CHF pair is trading in a local downtrend which we know by looking at the previous 1W candle which is red. On the 4H timeframe the pair is going down too. The pair is oversold because the price is close to the lower band of the BB indicator. So we are looking to buy the pair with the lower BB line acting as support. The next target is 0.561 area.
Disclosure: I am part of Trade Nation's Influencer program and receive a monthly fee for using their TradingView charts in my analysis.
✅LIKE AND COMMENT MY IDEAS✅
GBPUSD – Bears Defending the Confluence Zone?GBPUSD is approaching a strong confluence resistance area.
The current rally is bringing price into the intersection of:
🔴 The upper bound of the falling red wedge
🔴 A major resistance zone marked in red
This combination creates a strong non-horizontal resistance area where sellers could step back in.
As long as this intersection holds, we will be looking for trend-following short opportunities. 📉
The overall structure remains bearish for now, and this rebound can still be viewed as a corrective move within the broader downtrend.
A bearish rejection from this confluence zone could open the door for another leg lower toward the lower bound of the wedge and potentially the blue support zone below. 🎯
📌 The key level to watch is the confluence between the wedge resistance and the horizontal resistance zone.
Will the bears defend this area once again? 🤔
⚠️ Disclaimer: This is not financial advice. Always do your own research and manage risk properly.
📚 Stick to your trading plan regarding entries, risk, and management.
Good luck! 🍀
All Strategies Are Good; If Managed Properly!
~Richard Nasr
Ripple (XRP) Flashback Update: Wave 5 Downside ContinuationRevisiting our discussion from May 18 2026, the broader outlook already pointed toward increased volatility and downside pressure as macro uncertainty weighed on crypto assets. That scenario has since unfolded, with price action aligning closely with the bearish structure we highlighted at the time.
Looking at Ripple (XRP) on the 4-hour chart now, the market is extending lower with strong momentum following the completion of a bearish ABCDE triangle formation within wave 4. This structure appears to have acted as a terminal consolidation phase before the initiation of wave 5.
Wave 5 now appears to be in full development, pushing price action toward the key psychological and structural support around the 1.0 level. Within this final impulsive leg, the current movement can still be interpreted as a corrective sub-wave “iv” pullback inside wave 5. As long as price remains below the 1.29 invalidation level, the bearish structure remains intact, and the probability favors continuation lower into wave “v” of 5.
In terms of short-term structure, any temporary recovery should be treated cautiously, as it is likely part of internal wave progression rather than a trend reversal. The broader technical picture continues to favor downside continuation until wave 5 completes and a larger degree correction can begin forming.
Overall, the market remains in a late-stage bearish phase, where final wave exhaustion toward the 1.0 support zone is becoming the primary focus.
GOLD — 4268 support broken. Where next?The level that held since the Jun 5 NFP crash — 4268 — broke today. Price is now at 4177, a new multi-month low.
This was the bear continuation scenario from the Jun 8 post. The countertrend bounce toward 4424 never came.
The setup I'm watching:
If price retests 4268 from below and gets rejected — that's the short entry. 4268 is now resistance.
Entry zone: 4260–4275 on a retest
Target: 4100–4150
Invalidation: close above 4300
No retest needed if price just continues lower — next area of interest is 4100–4150 with no significant structure in between.
Bias : Bearish. Gold below 200 SMA for the first time since 2023, dollar above 100, rate hike expectations elevated. No reason to fade this move.
XAUUSD, what lies ahead ?Major bearish trendline is intact since the ATH of Jan 2026, and price has shown multiple rejections from it (marked by red arrows) forming a sustained bearish structure of LL & LH, as marked by Green path, price is expected to surpass the previous low of 4098 to keep the structure intact. Most recent rejection from the falling trendline came at 4595, which was a crucial resistance zone-1 and since then price is on a free fall.
DXY long term structure supports the gold down-move (Look at the referenced ideas).
Moving forward next support is seen at 4098, but if 4098 is broken then price might retest the level of 3900. Immediate resistance is at 4365.
If price shows some strong pull-backs, its expected to stopped-out at the bearish trendline. However immediate resistance is at zone-3 & above that 4363.
For Educational Purposes only, Not an Investment Advice.
Any new perspective you want to add, Please feel free to mention below in the comment.
Regards CrazyTrades247.
Gold — The next move is getting closer
🏆The previous bearish scenario played out exactly as expected after the bearish confirmer was lost, sending price directly into the lower demand zone.
Now Gold is building a new range structure between support and resistance, and the market is approaching a key decision point.
📈 Bullish scenario
If buyers can break and hold above the upper zone, we can expect a continuation toward the next major resistance area and potentially a larger bullish expansion.
📉 Bearish scenario
If the lower demand zone fails to hold, bearish momentum could return and open the path for another leg down.
For now, Gold remains inside the range, but pressure is clearly building near resistance. The next breakout could define the next major move.
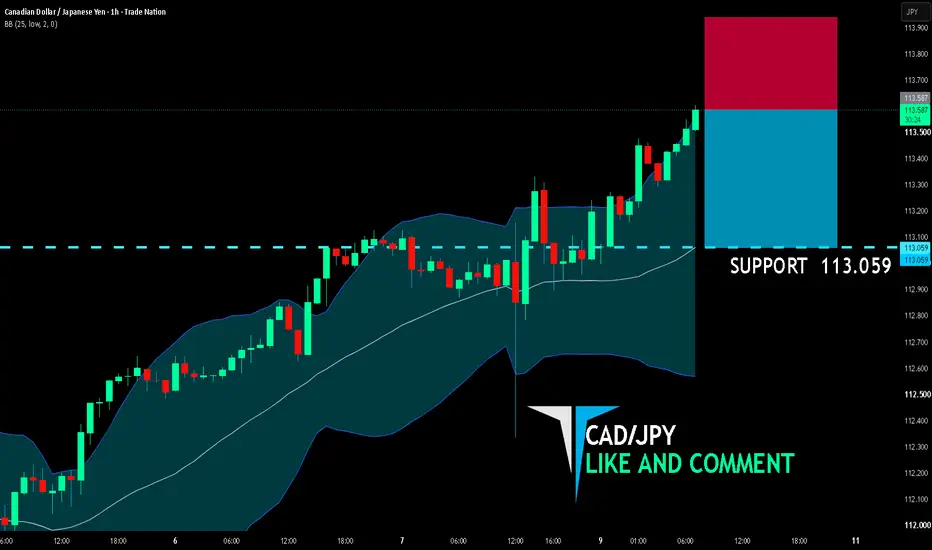
CAD/JPY BEARS WILL DOMINATE THE MARKET|SHORT
Hello, Friends!
CAD/JPY is making a bullish rebound on the 4H TF and is nearing the resistance line above while we are generally bearish biased on the pair due to our previous 1W candle analysis, thus making a trend-following short a good option for us with the target being the 114.593 level.
Disclosure: I am part of Trade Nation's Influencer program and receive a monthly fee for using their TradingView charts in my analysis.
✅LIKE AND COMMENT MY IDEAS✅
XAU/USD | Gold Liquidity Hunt before The Sell Trend continuationThe Gold Price on 30 minute shows a stark structural shift following a massive, aggressive expansion downward. The previous consolidation at the top of the range 4440 - 4450 was decisively broken displacing price into a heavily bearish market structure. Currently price is experiencing a minor corrective phase, carving out internal liquidity while preparing for its next macro expansion.
Key Confluences
The technical setup highlights a Inner Circle Trader (ICT) short presentation based on three key factors:
Fair Value Gap (FVG) The aggressive displacement left behind a large, unfilled bearish FVG between roughly 4380 and 4400. This acts as a magnet for a premium retracement.
Order Block (OB) Mitigation: Just below the FVG sits a well defined bearish Order Block line around 4365, marking the last institutional buying candle before the market collapsed.
Liquidity Engineering Trendline & Equal Highs: Gold Price is currently building engineered liquidity. We see a clean retail Trendline acting as support, alongside Equal Highs resting just above current price action. This builds up pool buy side liquidity that smart money will likely sweep before dropping the hammer.
Projected Path
The Retracement: Gold Price is expected to break above the immediate internal trendline compression, clearing out the buy side liquidity and trapping early retail shorters.
The Mitigation: This upward spike will drive price directly into the Premium FVG and OB zone 4365 - 4400 to mitigate orders and rebalance the market efficiency.
The Expansion Once institutional supply is tapped, a sharp reversal is projected to target the sell side liquidity resting below the current swing lows, driving hard toward the Liquidity Target New Low at 4100$.
Sentiment
Trade Sentiment Strong Short Bias or Bearish Continuation.
⚠️ Disclaimer: This is only for educational purposes. I'm not you Financial advisor.
BTC – Is History Repeating Once Again?To locate and time a potential cycle bottom, I am comparing the current Bitcoin cycle to the previous ones. 🧠
Interestingly, the structure continues to look very similar.
Just like in prior cycles, BTC is now retesting previous major highs, marked in green. Historically, these former resistance zones have often acted as support during major corrections before the next bull market began. 🔑
At the same time, the MACD is showing another encouraging sign. After months of bearish momentum, its angle is now starting to shift from downward to upward, similar to what happened near previous cycle lows. 📊
However, the bulls have not taken control yet.
For the next bull run to begin, a monthly candle close above the 9-period moving average is needed. Until that happens, the current recovery remains a potential bottoming process rather than a confirmed bullish reversal. ⚠️
The coming months could be critical as Bitcoin attempts to repeat the pattern seen in previous cycles.
Will history repeat itself one more time? 🤔
⚠️ Disclaimer: This is not financial advice. Always do your own research and manage risk properly.
📚 Stick to your trading plan regarding entries, risk, and management.
Good luck! 🍀
All Strategies Are Good; If Managed Properly!
~Richard Nasr
GBP/NZD BEARS ARE GAINING STRENGTH|SHORT
Hello, Friends!
The BB upper band is nearby so GBP-NZD is in the overbought territory. Thus, despite the uptrend on the 1W timeframe I think that we will see a bearish reaction from the resistance line above and a move down towards the target at around 2.277.
Disclosure: I am part of Trade Nation's Influencer program and receive a monthly fee for using their TradingView charts in my analysis.
✅LIKE AND COMMENT MY IDEAS✅
GBP/AUD SELLERS WILL DOMINATE THE MARKET|SHORT
GBP/AUD SIGNAL
Trade Direction: short
Entry Level: 1.893
Target Level: 1.887
Stop Loss: 1.896
RISK PROFILE
Risk level: medium
Suggested risk: 1%
Timeframe: 1h
Disclosure: I am part of Trade Nation's Influencer program and receive a monthly fee for using their TradingView charts in my analysis.
✅LIKE AND COMMENT MY IDEAS✅
Three Strikes And Support Is Out For AJ!OANDA:AUDJPY is currently trading up after making a significant drop in price, falling out of the Triangle pattern it formed, but this rise could just be a Pullback for a much larger move down!
After price delivered a False Breakout of the Horizontal Resistance @ 114.74, price fell through the local Rising Support, rendering this Support, no longer supportive.
Now, price seems to be forming a Low and could be working its way back up to Retest this Breakout of the Rising Support to potentially test as Resistance!
If this is the case and price rises and is rejected at this former Support Line, we should expect Short Opportunities to take price down to lower Support levels:
1) 111.595 - 111.324
2) 109.077 - 108.782
Fundamentally, June 15th - 16th will be impactful for both AUD and JPY with both the RBA and the BOJ looking to set Interest Rates, so stay vigilant!
USD/CHF SHORT FROM RESISTANCE
USD/CHF SIGNAL
Trade Direction: short
Entry Level: 0.797
Target Level: 0.793
Stop Loss: 0.800
RISK PROFILE
Risk level: medium
Suggested risk: 1%
Timeframe: 1h
Disclosure: I am part of Trade Nation's Influencer program and receive a monthly fee for using their TradingView charts in my analysis.
✅LIKE AND COMMENT MY IDEAS✅
XAGUSD — Patience Before the TurnThere are phases in the market where movement looks dramatic, yet structure is still incomplete.
Silver is currently in one of those phases.
Many traders are anticipating a reversal. The price is approaching levels that feel “cheap.” But markets do not reverse because something feels cheap. They reverse when structure completes.
Right now, structure is still unfolding.
1️⃣ Crowd Psychology
The crowd loves early bottoms.
Not confirmed bottoms — early ones.
The emotional urge to “catch the turn” is strongest when volatility increases. That is precisely when discipline must increase as well.
A level alone does not create a reversal.
Completion does.
2️⃣ Structural Thesis
From an Elliott Wave perspective, XAGUSD continues to develop within a broader Zigzag (A‑B‑C) formation.
The current focus is on the terminal phase of Wave 5 of A.
Internally, this fifth wave is maturing as a Leading Diagonal — a structure that often signals exhaustion, but only after its internal subdivisions complete.
The recent interaction with the Base Channel suggests that momentum has not fully dissipated yet. This implies the diagonal may require one more structural push before true exhaustion appears.
Structure first. Reaction later.
3️⃣ Tactical Focus
The working exhaustion zone remains:
61.745–61.745–54.219
This is not a prediction of certainty.
It is a mapped probability zone where Wave 5 of A could finalize, assuming the diagonal structure continues to behave as expected.
Until that structural completion is visible, aggressive positioning remains premature.
Patience here is not inactivity.
It is positioning without exposure.
4️⃣ Behavioral Trap
Most losses do not come from being wrong about direction.
They come from being early.
Entering before completion is like interrupting a sentence halfway and assuming you know the ending.
Markets tend to finish their sentences.
Final Thought
The market does not reward urgency.
It rewards alignment.
For now, Silver is not asking to be chased.
It is asking to be observed.
Structure never lies. It simply unfolds.
— Mr. Nobody
Elliott Wave Researcher
Educational analysis only. Elliott Wave interpretations are probabilistic and subject to change with new data. Risk management remains essential.
Silver / U.S. Dollar May 19: XAGUSD | 4H Wave Map — A Two-Layer Look at Structure
Classic Head and shoulders bearish reversal pattern on zec.Yes the Claude Exploit fundamentally is major cause for alarm with zcash. However regardless of that fundamental news, the charts had already painted the crash for zcash in this head and shoulders top pattern which we can see zcash has already hit the breakdown target of it. It also went a little lower than that target, which makes sense considering how much FUD the Claude exploit has stoked. The most alarming part of this is that the weekly stochrsi (not shown here because this is the daily chart) has only just begun to turn back downward and still has plenty of room to drop. So it’s fairly probable that the retracement for zcash still has more to go. *not financial advice*
CHF/JPY BEST PLACE TO SELL FROM|SHORT
Hello, Friends!
We are now examining the CHF/JPY pair and we can see that the pair is going up locally while also being in a uptrend on the 1W TF. But there is also a powerful signal from the BB upper band being nearby, indicating that the pair is overbought so we can go short from the resistance line above and a target at 201.760 level.
Disclosure: I am part of Trade Nation's Influencer program and receive a monthly fee for using their TradingView charts in my analysis.
✅LIKE AND COMMENT MY IDEAS✅
CAD/CHF SELLERS WILL DOMINATE THE MARKET|SHORT
Hello, Friends!
CAD/CHF pair is trading in a local downtrend which know by looking at the previous 1W candle which is red. On the 12H timeframe the pair is going up. The pair is overbought because the price is close to the upper band of the BB indicator. So we are looking to sell the pair with the upper BB line acting as resistance. The next target is 0.567 area.
Disclosure: I am part of Trade Nation's Influencer program and receive a monthly fee for using their TradingView charts in my analysis.
✅LIKE AND COMMENT MY IDEAS✅
BTC: Ready to Go Below $50K This Year!Hey Traders! 👋
If you’re enjoying this analysis, smash that 👍 and hit Follow for high-accuracy trade setups that actually deliver! 💹🔥
Bitcoin is finally doing what we’ve been warning about for weeks…
The bearish flag pattern has now broken down, and price is continuing lower after a clean rejection.
📉 Current Market Structure:
• Bearish flag breakdown confirmed
• No bullish strength visible
• Lower highs + weak price action
⚠️ What to Expect:
👉 This breakdown signals a strong continuation to the downside
👉 If the pattern plays out fully, BTC can drop to the $45K – $50K range this year
💡 The setup was clear — and now it’s playing out perfectly.
🧠 Reminder:
Don’t fight the trend. Right now, bears are in control.
📌 Stay prepared. Big move in progress.
💬 What’s Your Take?
Will BTC bounce from this level, or is there more downside ahead? Drop your analysis and predictions below—let’s navigate this together and secure those gains! 💰🔥🚀
BTC — One zone after another
🔥The bearish roadmap continued to play out exactly as expected:
Since the breakdown from the liquidity zone, price has been moving from one demand area to another, systematically sweeping liquidity and testing every highlighted zone along the way.
What's interesting is that every projected reaction area has now been reached, confirming the weakness of the current market structure and the strength of the bearish momentum.
Current structure:
• All previously highlighted zones have been tested
• Sellers remain firmly in control
• No meaningful bullish reclaim has occurred yet
• Downside liquidity continues to attract price
The final major support zone is now approaching.
If this last zone fails to hold, the next major downside objective sits below the 59K region, opening the door for a much deeper bearish expansion.
For now, the market remains under pressure, and buyers still have work to do before any meaningful reversal can be considered.
The liquidity got taken.
The zones got tested.
The roadmap keeps playing out. ⚡
GBP/AUD SHORT FROM RESISTANCE
Hello, Friends!
The BB upper band is nearby so GBP-AUD is in the overbought territory. Thus, despite the uptrend on the 1W timeframe I think that we will see a bearish reaction from the resistance line above and a move down towards the target at around 1.878.
Disclosure: I am part of Trade Nation's Influencer program and receive a monthly fee for using their TradingView charts in my analysis.
✅LIKE AND COMMENT MY IDEAS✅
EURUSD Bearish as Middle East Tensions Support USDHey Traders,
In today's trading session we are monitoring EURUSD for a selling opportunity around the 1.17100 zone. EURUSD is trading in a downtrend and currently is in a correction phase, with price approaching the **1.17100 support and resistance area**, which aligns with a key trendline resistance zone.
From a macro perspective, the US Dollar continues to benefit from ongoing geopolitical uncertainty and persistent inflation concerns. Following another round of overnight developments involving the United States and Iran, markets remain focused on the risk of further escalation and its potential impact on global energy markets.
As long as tensions remain elevated and there is no clear resolution regarding the Strait of Hormuz, inflation risks are likely to stay in focus. This supports higher interest rate expectations and continues to provide a strong fundamental backdrop for the US Dollar.
At the same time, the Euro remains vulnerable as investors favor the safety and yield advantage of the dollar in the current environment. With EURUSD correcting into a key resistance zone within a broader bearish structure, rallies continue to look attractive for sellers.
As long as price remains below the **1.17100 resistance zone**, the bearish structure remains intact, and we anticipate continuation toward lower support levels.
Trade safe, Joe.