BTC heading sub 50K levels ?Declining channel is intact since October 2025, and price is respecting its boundaries by taking support & resistance form the lower & upper boundaries of the channel, as pointed by green and red arrow.
For the period of 4 months price consolidated near its support level of 62,300 and had showed multiple bounces in the upper direction, which couldn't sustain, now price is at an crucial point where, it's threatening the long standing support level so 60,000.
It 60k is out then consider a quick down-move, following to that subsequent bearish moves can test the levels below 50,000 as per the structure of channel intact.
Strict Risk management should be applied and Position should be sized according to individuals risk appetite.
For Educational Purposes only, Not an Investment Advice
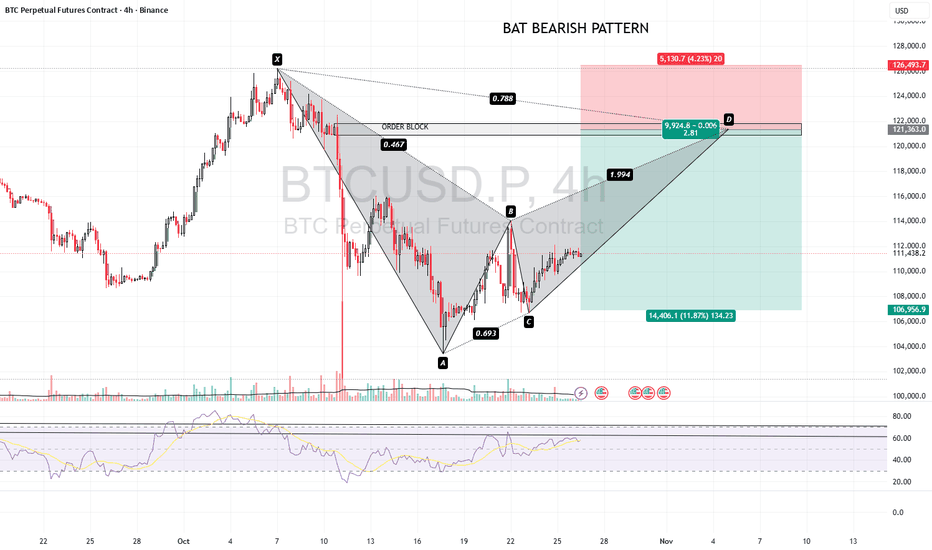
Bearish Bat
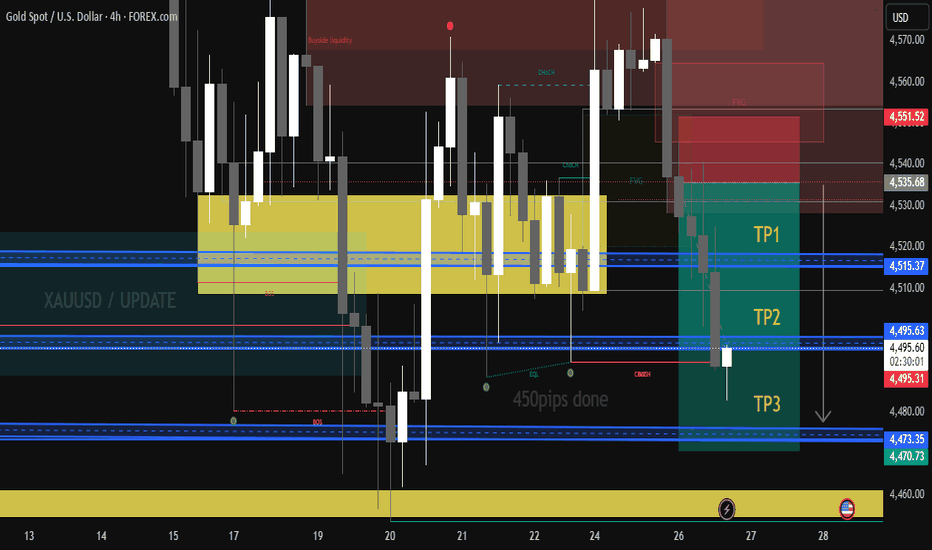
XAUUSD – 4H Update | May 26, 2026Market Structure
Price has been ranging within a key consolidation zone (yellow zone) between approximately 4,460 – 4,535. After completing a 450-pip bullish move, price has now rejected from a Fair Value Gap (FVG) and CHoCH (Change of Character) level near 4,535, signaling a potential bearish pullback phase.
A BOS (Break of Structure) to the downside was recently confirmed, shifting short-term bias bearish.
Target Levels (Short Setup)
LevelPriceTP14,515.37TP24,495.63TP34,473.35 – 4,470.73
Key Zones
Resistance / Supply Zone: 4,535.68 – 4,551.52 (FVG above)
Current Price: 4,494.13
EQL (Equal Lows): ~4,493.72
Strong Support / Demand Zone: 4,460 – 4,470
Analysis Reasoning
Price tapped into a premium FVG after a strong rally. The CHoCH and subsequent BOS confirm short-term bearish momentum. The objective is a retracement back into the 4,470 – 4,515 demand area, where buyers may re-engage.
This idea is for educational purposes only and does not constitute investment advice.
TradingView House Rules Compliance
No external links, contacts, or promotions included
No fundraising or solicitation
No plagiarized content
Written in English, clear title and reasoning provided
No misleading or harmful content
No ALL CAPS spam or emoji walls
Content does not constitute investment advice (Rule 17)
This description is ready to copy-paste directly into TradingView when publishing your idea. Want me to adjust the tone, add more technical detail, or format it differently?Sonnet 4.6
VVVusdt: Double top FormationHello Traders!
We were waiting for this rise in VVV and now market is here. Its a Double top formation and there are many bearish pattern which will not let VVV pump more. Its now at the top and bears will take control now.
Stoploss 21.688 (-20.1%)
Target 10.102(+44%)
My aim is to achieve highest win rate in tradingview trading community :) and we will definitely do that.
Trade Analysis Based on
> Fibonacci Tool (A1000x Way) – Custom Fibonacci approach for precise market analysis
> Candlestick Patterns – Strong price action confirmation through key candle formations
> A1000x Breakout Strategy – Identifying and trading high-probability breakout setups
> HH, HL & LH, LL Strategy – Market structure analysis for clear trend direction
> Swing Points – Tracking key highs and lows for accurate price movement insight
> A1000x Stoploss Strategy – Strategic stoploss placement for effective risk control
> A1000x Target Strategy – Structured target setting based on price action
We trade using carefully developed strategies and disciplined market analysis, always seeking the best possible accuracy while remembering that ultimate success comes only by the will of Allah.
In some trades, you may notice a relatively larger stop loss or a risk-to-reward ratio that may appear unusual at first glance. However, every trade is taken with proper planning and calculated analysis, not random entries.
Before entering any position, we perform detailed calculations and market evaluation. Based on this analysis, we carefully determine our stop loss and target levels.
I personally apply one of my specialized stop-loss and target strategies, designed to place the stop loss at a logical market level where price is less likely to reach before moving toward the intended target — InshaAllah.
Trading always involves risk, but with discipline, patience, and proper strategy, we aim for consistent and responsible decision-making.
Feel free to share your thoughts, leave a comment, or contact me.
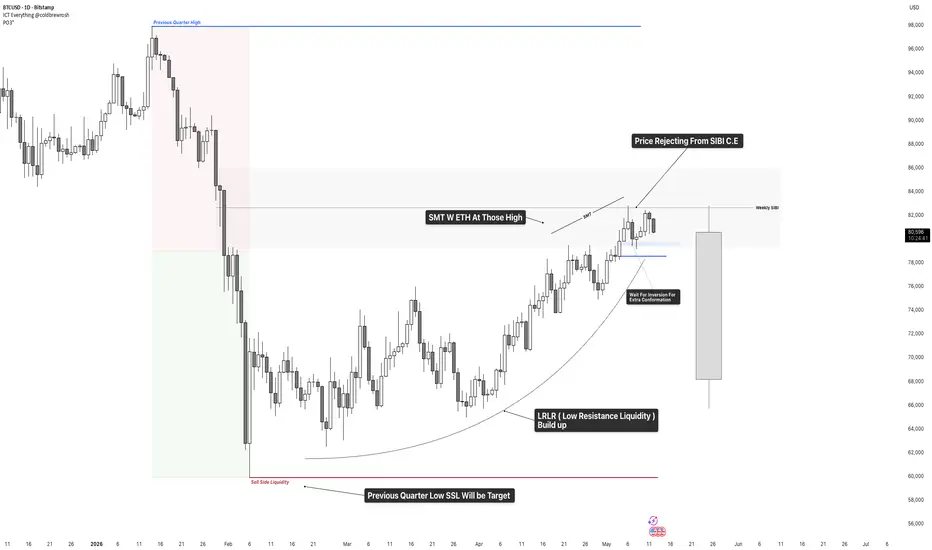
Is BTC About To Trap Late Buyers Before A Big Drop?Market Context
BTC rallied aggressively from the quarterly lows using a clean LRLR (Low Resistance Liquidity Run).
Price is now trading directly into weekly premium pricing and weekly SIBI resistance.
Momentum is slowing down exactly where higher timeframe sellers are expected to react.
👉 This is where continuation traders usually get trapped.
What Makes This Interesting
Clear SMT divergence with ETH at the highs
→ BTC made relative strength highs while ETH failed to confirm.
Price is rejecting from Weekly SIBI C.E
→ Premium pricing is currently being respected.
Structure is becoming corrective instead of impulsive
→ Expansion higher is weakening.
My Main Idea
I’m waiting for inversion / CISD confirmation before getting aggressive short.
If BTC starts accepting below the current support area, then I expect:
delivery to shift lower,
LRLR buildup to unwind,
and price to seek sell-side liquidity below.
Main Draw On Liquidity
Previous Quarter Low SSL remains the larger objective.
If bearish delivery confirms, that becomes the magnet.
Important Level
Current short-term support is the decision point.
👉 Hold above it and BTC can continue consolidating higher.
👉 Lose it with displacement and this turns into a much larger distribution phase.
Most traders only focus on price going up.
I’m more interested in how price is delivering at premium. Right now, it’s starting to look heavy.
Oil Crash Alert - Bearish ImpulseTVC:USOIL Crash Alert - Bearish Impulse
Summary: #CrudeOil Crash Signal
- BLACKBULL:WTI Crash Impulse scenario in play.
- ICMARKETS:XTIUSD Sell Positions in focus.
Confirmation below $91.
Tech. Analysis: #CrudeOil ( BLACKBULL:WTI ) Short Signal
Chart Structure:
- Elliott Wave: Zig-Zag Correction
- Intermediate (B) Completion
- Harmonic Pattern
- Oil Bearish Fractal (COVID)
TVC:USOIL ( BLACKBULL:WTI ) Prediction:
- Bearish Crash Impulse
- Intermediate Wave (C)
FX:USOILSPOT Trade Levels
- Ticker: XTI/USD
- Direction: SHORT
- Market Entry @ $97.5
- Strategic Entry 1 @ $101
- Strategic Entry 2 @ $108
- Breach Entry @ $91
- SL @ $108 & $116 & $122
- TP1 @ $85, TP2 @ $74, TP3 @ $67, TP4 @ $61
* Trade-Signals are subject to risk, DYOR.
* Not investment advice, only market commentary.
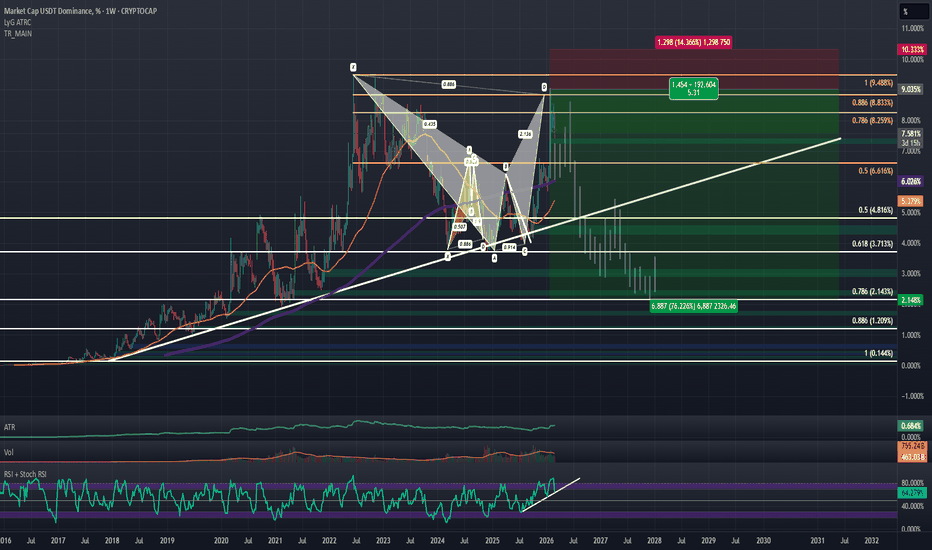
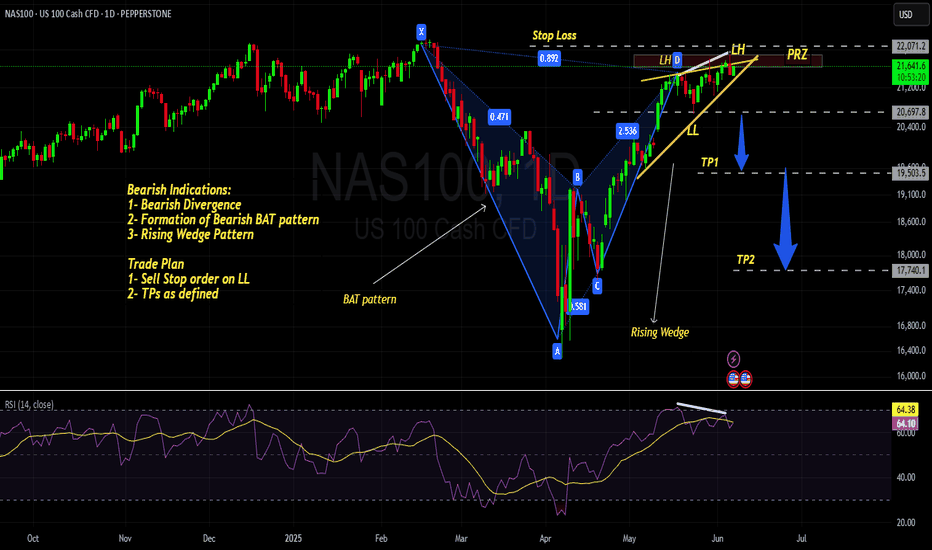
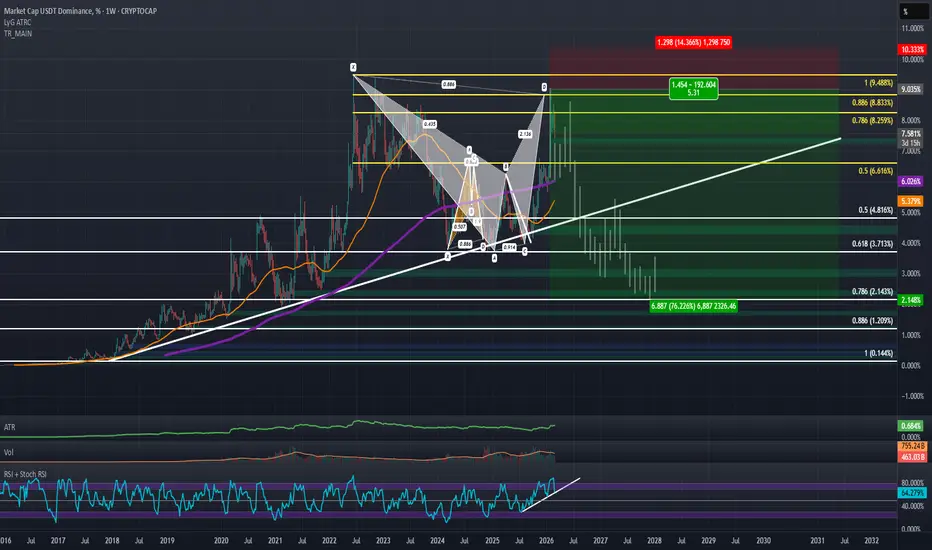
USDT Dominance: Bearish Bat; 3 Line Strike; RSI BreakdownOne of the main contributing technical reasons to my recent shift in being Bullish on crypto at these lows has been the USDT Dominance chart. Previously when I was Bearish, USDT.D was holding support at a trendline which aligned with the 61.8% retrace and had developed a local harmonic at the low and during the recent drop in crypto, the USDT Dominance rose back up and made a 0.886 retrace. It just so happens that in the process of doing so USDT.D completed an even bigger potential Bearish Bat Pattern. As its spent the last few weekly candles trading around the 0.886 retrace and rejecting it, the weekly candle now looks like it's going to take out the last few weeks of attempted bullish price action to confirm a Bullish 3 Line Strike which has historically been a very powerful Bearish Reversal candlestick pattern; and to do so on such a high time frame (the weekly) at the 0.886 Completion of this Bearish Bat while showing buyer exhaustion on the RSI which seems close to breaking down its trendline and killing the momentum; seems to all but confirm that the USDT Dominance will see a notable decline in the near future; one that may even result in the break of the uptrend and of the 61.8% retrace. If these supports break the only Harmonic BAMM Target for the USDT Dominance will be down at the lows of the 0.786 or even the 0.886 which from there we could be on the look out for a potential future Bullish Gartley, but for the time being declining to those retraces would result in a 50-80% decline in the US Dollar Dominance within the crypto market, which would mean that on the other end of that trade you will see the TOTAL marketcap dominance of Bitcoin and Other Cryptos start to rise at a similar rate.
#BAT/USDT#BAT
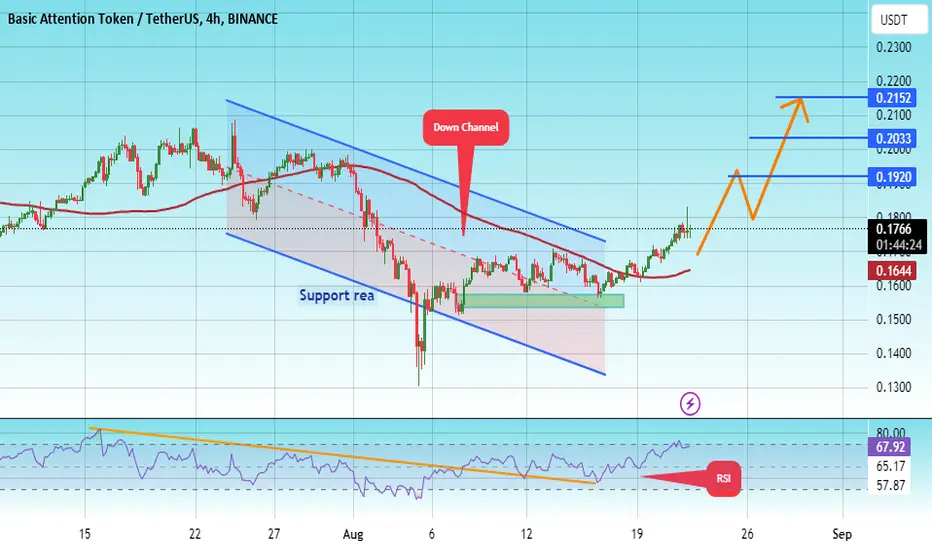
The price is moving in a descending channel on the 4-hour frame and is sticking to it very well and is expected to break it upwards
We have a bounce from a major support area in green at 0.1550
We have a downtrend on the RSI indicator that was broken upwards which supports the rise
We have a trend to stabilize above the 100 moving average which supports the rise
Entry price 0.1700
First target 0.1920
Second target 0.2033
Third target 0.2152
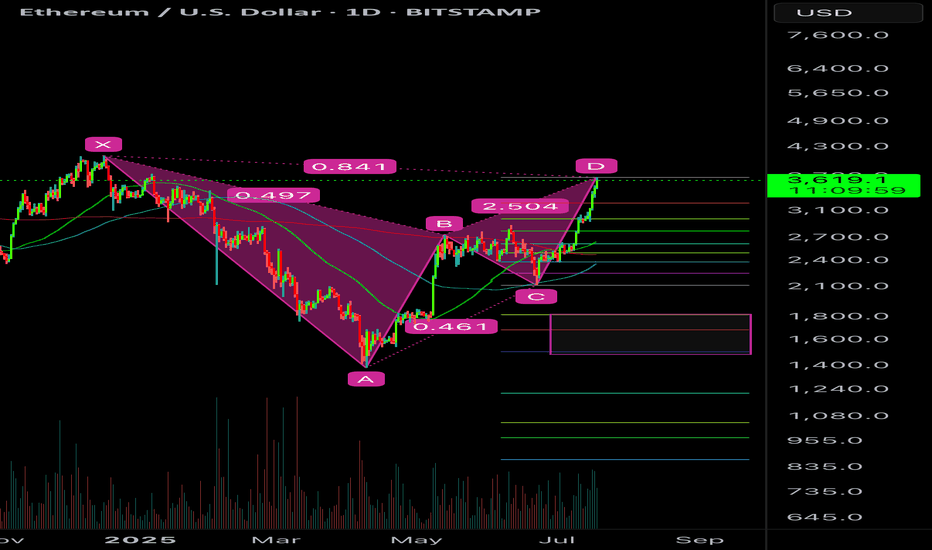
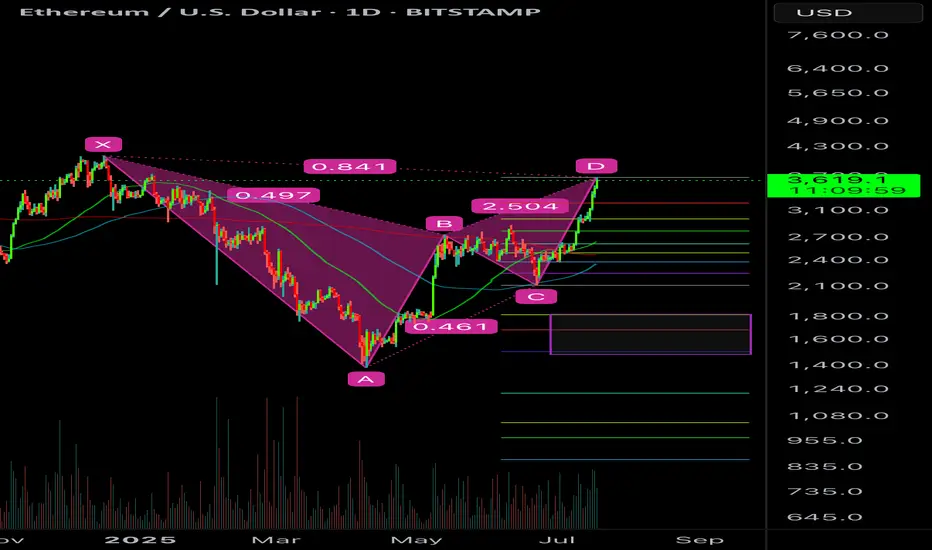
ETH BEARISH BAT POTENTIALETH can go slightly higher but it’s at/near the .886 retracement and meets a valid bearish bat pattern.
I would be targeting a full move if it is unable to break above the .886.
Too many euphoric here. The move has been really scammy off the hype news of Genius Act which everyone saw coming. Expect a sell the news event and BTC.D bounce would destroy alts for one last capitulation most alts may drop 40-50% from here. Then the real bull will start.
GBPCAD - Bearish BAT Pattern Market is forming Bearish BAT pattern, we plan our entry on break on "A" point and then plan our TP till market reaches PRZ. as these pattern are reversal patterns, we plan our next entry on D point after good bearish signal is observed. we will look into divergence or any good bearish candle. as BAT pattern usually form Divergence before Bearish trend.
For Buy Entry : Place stop loss below the "C" point and TP at PRZ
For Sell Entry : Place stop loss above PRZ (which is also a good resistance level)
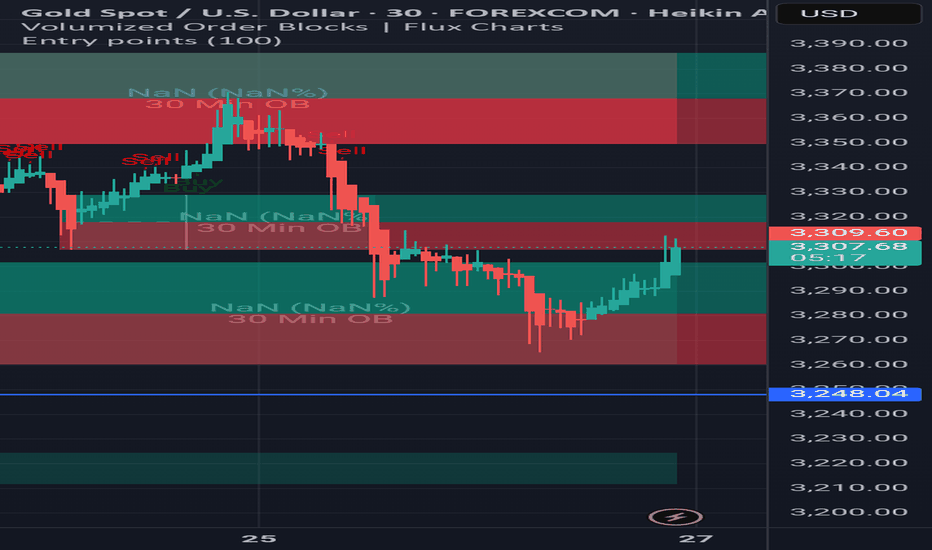
Should I hold my short at $3,305.69, or exit now What do you think, fam? Should I hold my short at $3,305.69, or exit now with gold so close to my stop-loss at $3,306.57? Drop your thoughts below—I’m curious to hear how you’d play this XAU/USD setup! If you’re one of the two ready to join me at Academia for Forex Trading, let’s talk—we’ll hunt these markets together. And while you’re at it, check out Icon Collections Store—does RiverSide, Desire, or Icoca vibe with your trading energy? Let me know!
Two reasons to sell FTSE Right NOWWe are seeing some reasons to sell FTSE right now.
1) The daily trend is down.
2) H4 is pointing down, but the price is above the MA
3) There are two patterns to sell at the current level
4) 8165 is the last weeks high that will be a good resistance
Hoping for a test of last week's lows.
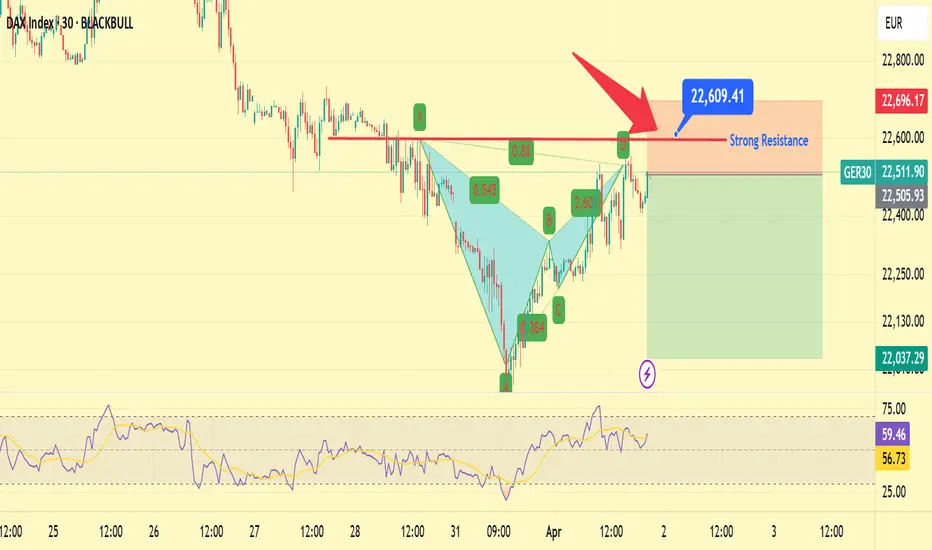
Trading GER30 on Tariff DayToday will be a big day for the stock market in 2025. The tariffs to be implemented promises to either make or break the market.
Last week we saw a massive sell off and on Monday and Tuesday we have seen the markets gain a decent amount. However here is what needs to be noted for all indexes:
1) The Daily downtrend is intact
2) The H4 MA is pointing down
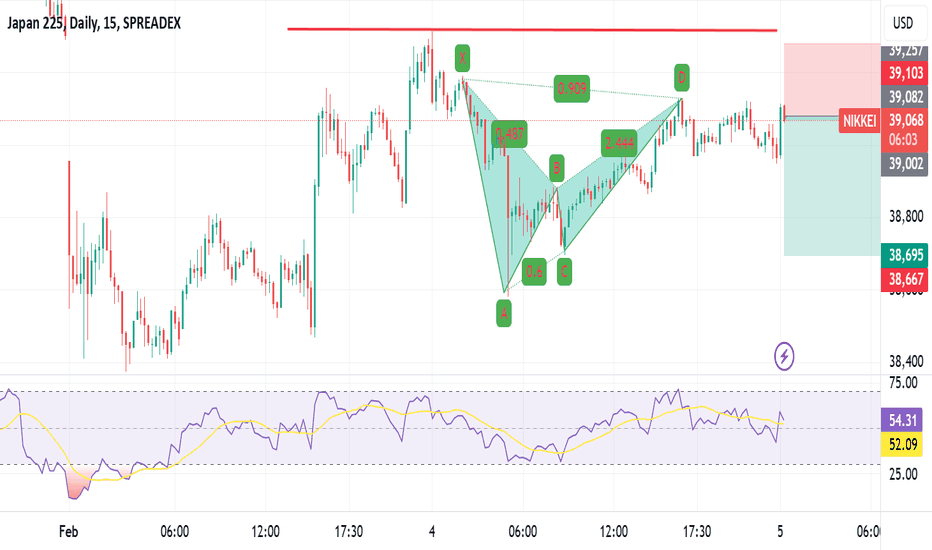
3) On GER30,we see a bat pattern to sell
4) H1, M30, M15 is OB and has a double top
We should not follow the news, but instead focus on the charts. Based on this, we will enter a short position and expect the market to resume the downtrend.
Stop loss will be 200 pips around 25700. Good luck!
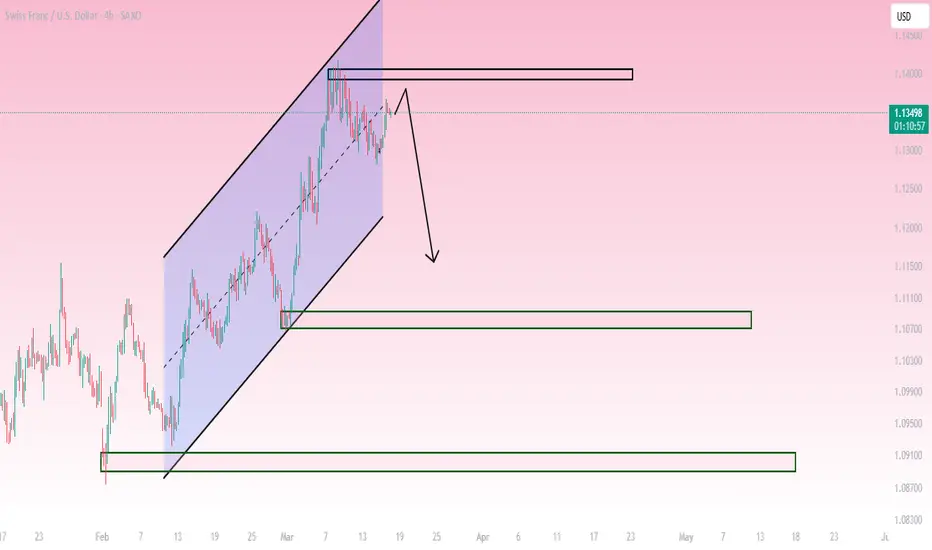
CHF/USD 4H Analysis - Potential Bearish Reversal Setup
🔹 Market Structure & Price Action:
The price has been trending upwards inside a rising channel, forming higher highs and higher lows.
Recently, price tapped into a key resistance zone (black box), indicating a potential reversal.
A possible bearish correction could unfold from this level.
📉 Bearish Scenario:
If the price fails to hold the resistance, a bearish rejection could drive price downward.
The first major support target aligns with the previous demand zone around 1.10700.
A further drop could test the 1.09100 support area, as shown in the green zones.
📈 Bullish Alternative:
A break and hold above resistance could invalidate the bearish setup and signal further upside movement.
🔻 Trading Plan:
Sell bias near resistance with confirmations (e.g., rejection wicks, bearish engulfing, trendline break).
Targeting the marked support levels.
Invalidation if price breaks and closes above the resistance.
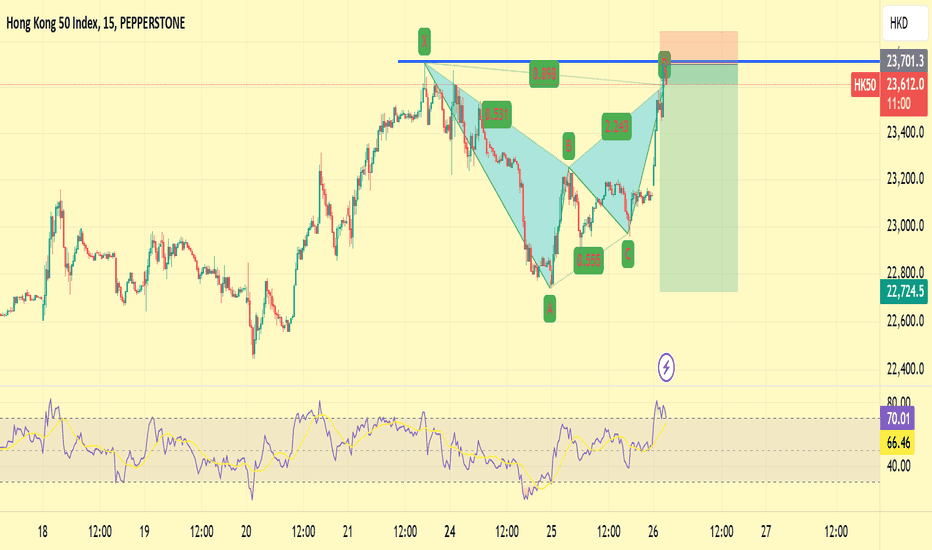
A massive drop on HK50 coming upThere is a huge pattern on the Daily Chart to sell the HK50 index pointing to a 2000 pip drop. However we are going to take the smaller pattern on this as shown below.
1) We are approaching the strong resistance zone of 23,650
2) There is a bat pattern
3) This is counter trend, so we will wait for 2-3 hours to take this trade
Will update when we take the trade.
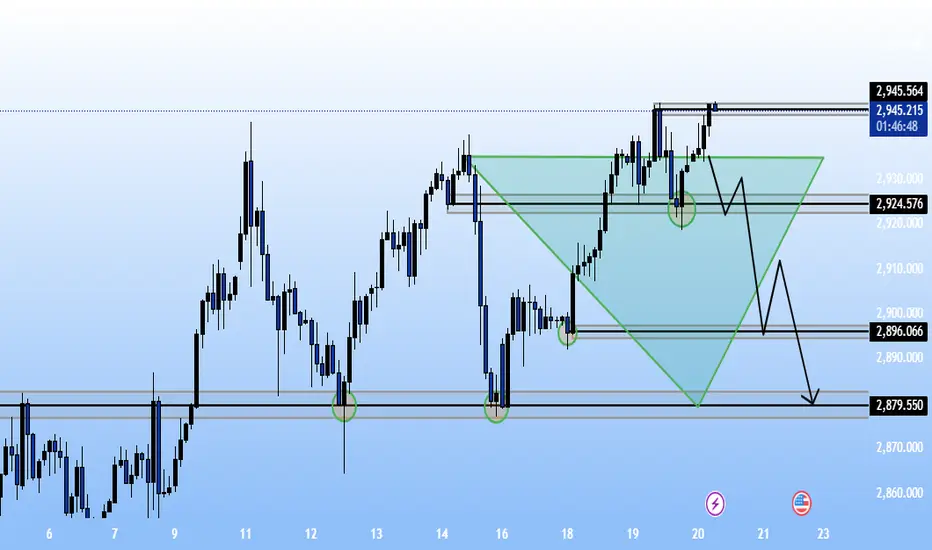
Candlestick chart.• Chart Type: Candlestick chart.
• Key Price Levels:
• The price is currently around 2,947.210.
• Resistance zone near 2,947.210 - 2,945.564.
• Support zones at 2,924.576, 2,896.066, and 2,889.915.
• Further downside target at 2,879.550.
• Pattern: A potential Head and Shoulders or Bearish Reversal pattern is drawn.
• Projection:
• A rejection from the upper resistance zone is anticipated.
• Price may consolidate before breaking lower.
• Bearish targets are marked at 2,896.066, 2,889.915, and 2,879.550.
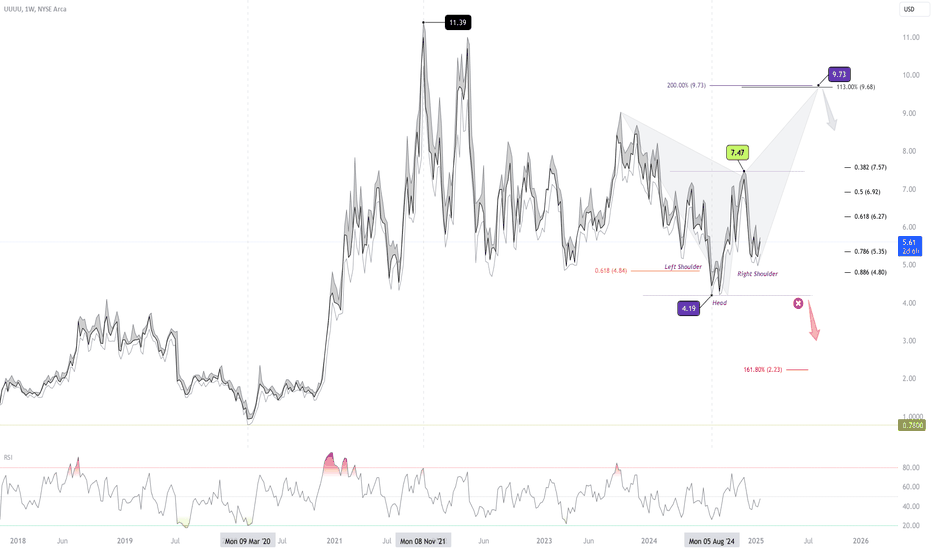
Energy Fuels Stock: Potential Reversal Ahead?AMEX:UUUU
After reaching a low of $0.78 in March 2020, AMEX:UUUU has been on a recovery path. Currently, it's forming an inverted head and shoulders pattern, with the key neckline at $7.47. A breakout above this level could signal a move towards $9.73.
However, watch out for the bearish alt-bat pattern near $9.73, which could lead to a pullback. Stay alert for key price action and adjust your risk accordingly.
⚠️ Note: Any violation of the $4.19 support would invalidate the projected patterns in this idea.
AUDCAD BAT PATTERNHarmonic Pattern Trading Strategy:
1. Combine patterns with 2-3 confirmations (e.g., MA, BB, RSI, Stoch) for increased accuracy.
2. Implement proper risk management.
3. Limit exposure to 3% of capital per trade.
4. Exercise caution: Not every Harmonic Pattern presents a good trading opportunity.
5. Conduct thorough diligence and analysis before trading.
Disciplined approach = Enhanced edge.
EURNZD BEARISH BATHarmonic Pattern Trading Strategy:
1. Combine patterns with 2-3 confirmations (e.g., MA, BB, RSI, Stoch) for increased accuracy.
2. Implement proper risk management.
3. Limit exposure to 3% of capital per trade.
4. Exercise caution: Not every Harmonic Pattern presents a good trading opportunity.
5. Conduct thorough diligence and analysis before trading.
Disciplined approach = Enhanced edge.