 Long
Long
 Short
Short
Long 
 Long
Long
Long 
Energy Fuels: Uranium, Rare Earths and a Classic Cup & Handle SeSometimes markets leave clues that look almost like a textbook pattern. That is exactly what is currently forming in Energy Fuels (UUUU) - a company positioned at the intersection of two strategic sectors: uranium and rare earth elements.
Energy Fuels is widely known as one of the largest uranium producers in the United States, but in recent years the company has been transforming into something much bigger: a key participant in the Western supply chain of critical minerals.
At the center of this strategy stands White Mesa Mill, the only operating uranium processing facility in the United States. Beyond uranium, the mill is increasingly used for processing rare earth concentrates - an industry that is becoming strategically important as Western countries attempt to reduce dependence on Chinese supply chains.
The fundamental story reflects this transition.
The company’s market capitalization has grown to approximately $4.86 billion, highlighting the rising investor interest in both uranium and rare earth metals. For 2025, Energy Fuels reported revenue of $78.7 million, while net loss reached $97.8 million, leaving EPS at –$0.38.
While profitability has not yet been achieved, this is typical for companies investing aggressively in infrastructure and production capacity.
Where Energy Fuels stands out is its balance sheet.
The company currently holds $861.8 million in cash, with minimal debt obligations. This financial flexibility provides a strong foundation for expanding its rare earth processing capabilities and scaling production without immediate reliance on external financing.
Energy Fuels is also pursuing several strategic initiatives aimed at strengthening Western supply chains for rare earth elements. Production of NdPr oxide - a critical component used in high-performance magnets for electric vehicles has already begun. Current capacity is sufficient to supply magnets for approximately 1 million electric vehicles annually, with plans to expand production to support up to 6 million vehicles by 2027.
Meanwhile, the uranium segment remains equally important. Since 2017, Energy Fuels has accounted for roughly two-thirds of all uranium produced in the United States , reinforcing its strategic role in domestic nuclear energy supply.
Now let’s look at the technical picture.
On the daily chart, Energy Fuels is forming a classic “cup and handle” pattern, one of the most recognizable continuation structures in technical analysis.
Following the formation of the cup, price entered a consolidation phase that is currently shaping the handle inside a descending wedge. The pullback has brought the stock directly into a major confluence zone, where several technical factors align:
• 0.5 Fibonacci level near 20.02
• 0.618 Fibonacci level near 18.14
• MA100 moving average
• Historical liquidity support
Such areas often become accumulation zones where institutional capital begins positioning ahead of potential trend continuation.
Price is currently testing this support region and starting to show signs of buyer reaction. If the level holds and the handle structure resolves to the upside, the cup & handle pattern projects a potential target near 43.79 , representing a significant upside move from current levels.
Of course, this bullish scenario remains conditional. A loss of support near 18 would invalidate the structure and open the door for deeper downside.
But for now, Energy Fuels sits at a fascinating intersection where strategic commodities, strong balance sheet positioning, and a classic technical pattern converge.
And markets rarely ignore such combinations for long.  Long
Long
Selena | XAUUSD · 2H – Bullish Structure Holding DemandFOREXCOM:XAUUSD PEPPERSTONE:XAUUSD
Market Overview
The market recently experienced a healthy correction after testing the upper resistance area. Price is now consolidating around the 5,050–5,100 demand zone which aligns with the ascending trendline support. This area represents a key structural level where buyers may attempt to regain momentum. If the demand holds, the market could resume the broader bullish trend toward the upper liquidity zone.
Key Scenarios
✅ Bullish Case 🚀
• Hold above 5,050 demand zone
• 🎯 Target 1: 5,350
• 🎯 Target 2: 5,500
• 🎯 Target 3: 5,600
❌ Bearish Case 📉
• Break below 5,040 support
• 🎯 Downside Target 1: 4,980
• 🎯 Downside Target 2: 4,900
Current Levels to Watch
Resistance 🔴: 5,300 – 5,350
Major Resistance 🔴: 5,550 – 5,600
Support 🟢: 5,050 – 5,090
Major Support 🟢: 5,000
⚠️ Disclaimer: This analysis is for educational purposes only. Not financial advice. Long 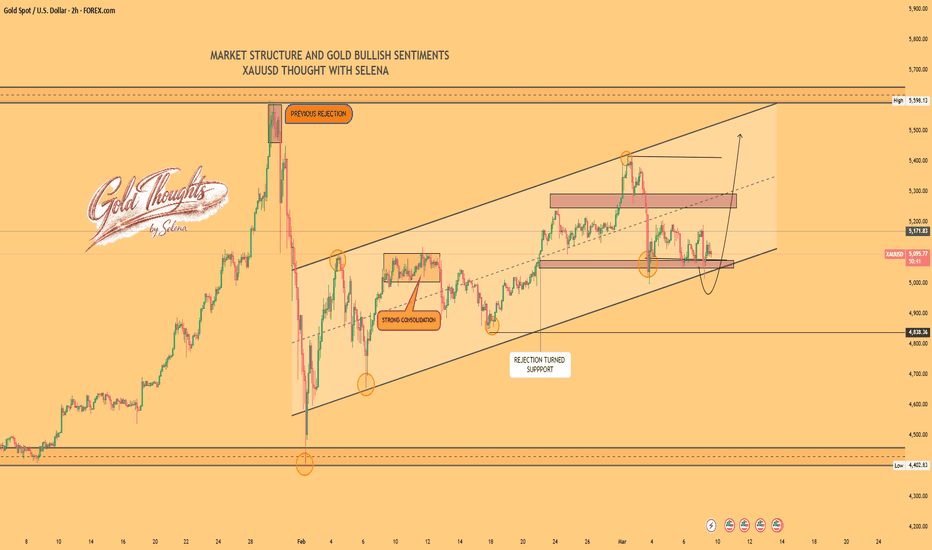
 Long
Long
 Long
Long
ABSLAMC is breaking out of a weekly cup & handleNSE:ABSLAMC has formed a multi-week Cup & Handle pattern and has broken out above the neckline last week with a bullish candle , delivering a 3.45% gain.
Additionally, its sectoral index, NSE:NIFTY_CAPITAL_MKT , recently took support at the 200-day EMA on the daily timeframe two days ago, accompanied by a bullish reversal in the RSI, which further supports the top-down approach .
The Weekly RSI (14) currently stands at 63.73, supporting strong bullish momentum while still leaving sufficient room for further upside before entering the overbought zone. The RSI has taken support near the 60 level, indicating a range shift into a hyper-bullish phase . This range shift, along with the Cup & Handle breakout, confirms the continuation of the prevailing bullish trend. Over the past few weeks, the RSI has also undergone a consolidation phase within the broader uptrend and with a break of the bearish counter trendline. A move above the 70 level could further strengthen the bullish momentum and open the possibility of the stock moving towards new highs.
The 20-week EMA is trending upward and closely tracking price action, acting as a dynamic support for the ongoing bullish trend . Additionally, the 20-day EMA has remained above the 50-day EMA since November 2023 , highlighting a strong short-term bullish structure and sustained outperformance of the stock irrespective of broader market sentiment. On the higher timeframe, the 50-week EMA has consistently acted as a dynamic support zone and continues to slope upward, reinforcing the strength of the long-term uptrend.
If the stock sustains above 840, NSE:ABSLAMC could potentially move toward the 1060 zone. Consider waiting for pullbacks toward the Cup & Handle neckline at the range of 910-915 for favorable entry opportunities with best Reward-to-risk ratios, with a stop-loss placed at 845 and an upside target near 1280 , in line with the pattern projection.
Key Support Levels: 880, 865, 845.
Targets : 1060,1155,1270.
Disclaimer:
Investments in the securities market are subject to market risks, read all related documents carefully before investing. Securities quoted here are exemplary, not recommendatory. Please consult your financial advisor before investing. Please note that I do not guarantee any assured returns for the securities quoted here.
Hari Narayan N
Charted Market Technician-CMT (All 03 levels cleared) Long 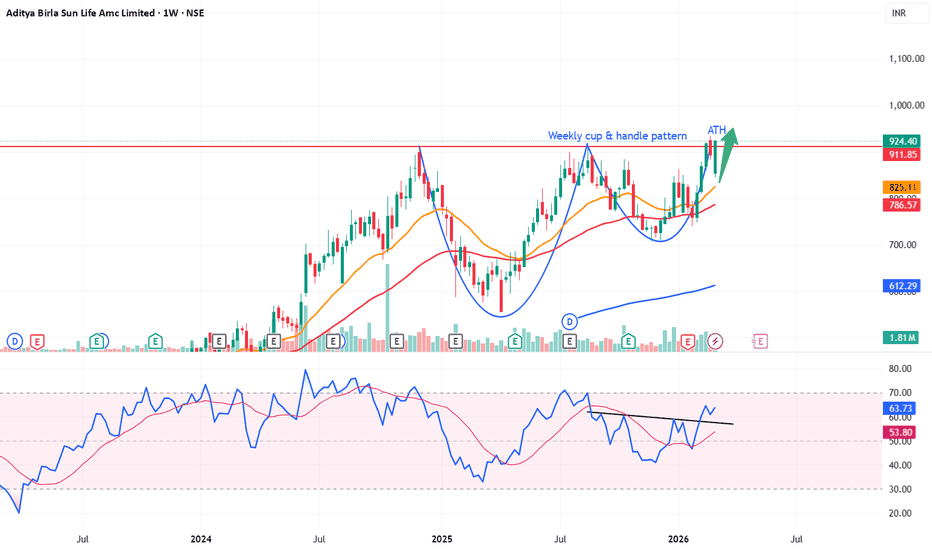
 Long
Long
Key Breakdown Levels Ahead: Gold Eyes 5k and 127.20%–161.80% ExtAfter analysing multiple timeframes, price has declined into the 50% higher‑timeframe Fibonacci retracement, which is a key level. If this level breaks, price is likely to extend deeper toward the 127.20% Fibonacci extension.
At the moment, the chart shows an inverted Cup & Handle pattern, which historically has a strong success rate. The measured‑move target of this pattern aligns with the 161.80% level. A clean break below 5,000 would open the door for a further decline toward the 161.80% extension.
From a Fibonacci perspective, price has already completed its 50% retracement, and the pattern structure provides additional confirmation of a potential continuation lower—first toward 5,000, and then toward the deeper extension levels mentioned above.
On the weekly timeframe, price has also formed a significant bearish divergence, which supports the possibility of a broader corrective phase. The next move will depend on how price reacts around these key levels.
From a fundamental standpoint, geopolitical tensions typically support higher gold prices. However, during periods of conflict, transportation disruptions and flight cancellations can negatively impact physical gold supply chains, which may limit upside momentum. Short 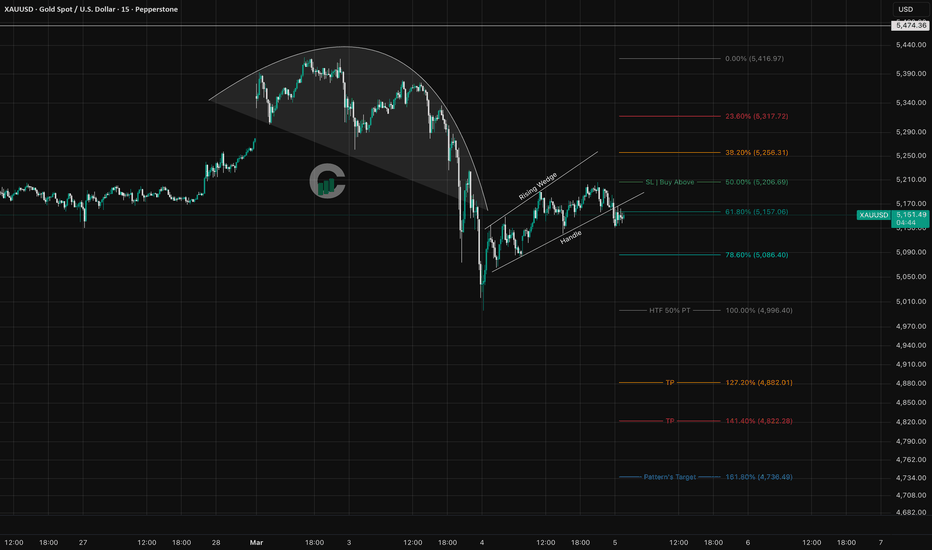
 Long
Long
 Long
Long
Long 
 Long
Long
 Long
Long
J&KBANK | Buy @122 | SL below 95 | Targets 146, 170, 280*********************************************************************
Disclaimer (Please Read Carefully):
This is not investment advice. The stocks shared here are purely for educational and informational purposes. Please do your own research or consult with a financial advisor before making any investment decisions.
******************************************************************************************************************
Stock market में सिर्फ risk ही risk होता है। Market में survive करने का एक ही तरीका है, stop loss को पूरी discipline के साथ accept करना। अपनी capital को protect करने का इससे बेहतर कोई तरीका नहीं है।
मैं जो भी stock यहाँ शेयर करता हूँ, वो या तो मेरी existing holding में होता है, या फिर मैं उसी level पर fresh buying या add on करता हूँ जिसे मैं mention करता हूँ।
मैं हमेशा buy करते समय अपने system में stop loss ज़रूर लगा देता हूँ, और मेरे लिए stop loss, target से भी ज़्यादा important होता है।
Target achieve होने के बाद मैं पहले profit book करता हूँ और फिर retest या fresh breakout का इंतज़ार करता हूँ।
मैं सिर्फ breakouts पर buy करता हूँ, कभी भी support पर नहीं। और मैं resistance पर sell भी नहीं करता।
******************************************************************************************************************
The stock market involves risk, risk, and only risk. To survive in the market, accepting stop-loss with discipline and without hesitation. There is no other way to protect you capital.
Any stock I share is either already part of my existing holding or I take a fresh entry at the same level I mention. I always place the stop-loss in my system at the time of buying, and I give the highest importance to stop-loss more than the target. Once the target is achieved, I usually book profit once and then wait for either a retest or a fresh breakout.
I buy only on breakouts, never on supports. I also do not sell at resistance levels.
That is simply my trading style.
 Long
Long


