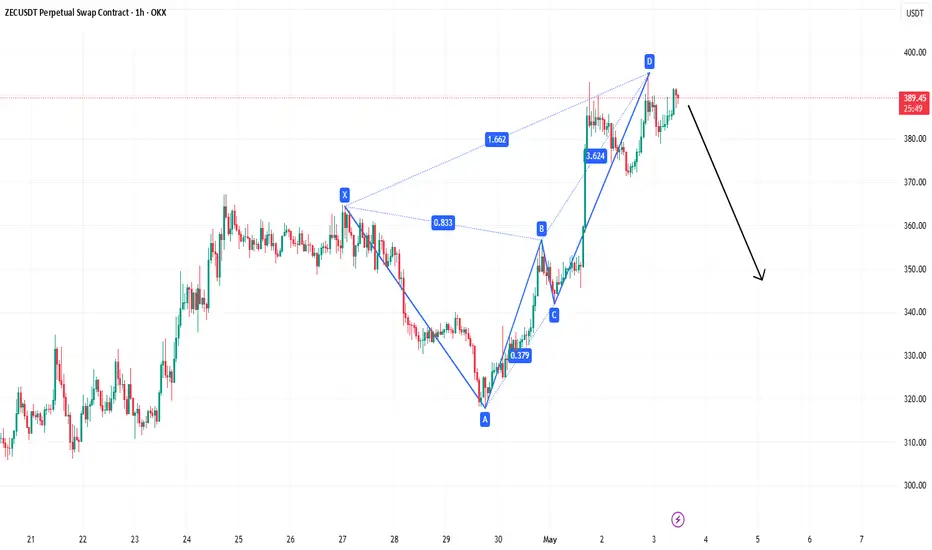
ZECUSDT 1H Deep Crab Harmonic Pattern CompletedThis is a textbook Deep Crab setup — one of the most powerful reversal patterns in harmonics.
Pattern Analysis:
Points clearly labeled: X → A → B → C → D
Point D completed at the extreme 1.618+ extension of the XA leg (classic Deep Crab territory)
Beautiful Fibonacci alignment: 0.379, 0.833, 1.662, 3.624
Strong rally into D followed by initial rejection — exactly what we want to see at completion
The black arrow on the chart projects the expected strong downside reversal.
Why This Deep Crab is High-Probability:
Deep Crabs are known for their accuracy because of the deep extension at D
Excellent structure with proper leg proportions
High risk-reward: Tight stop above D vs large potential move lower
This is a high-confluence setup. Deep Crab patterns often produce sharp, fast moves once they confirm.
Who’s watching ZEC with me? Drop a 🔥 if you see the reversal coming!
Deep Crab
Bitcoin reversal confirmed ?!Bitcoin reversal confirmed ?! 👀
I would like to present you some charts with important levels and relevant patterns.
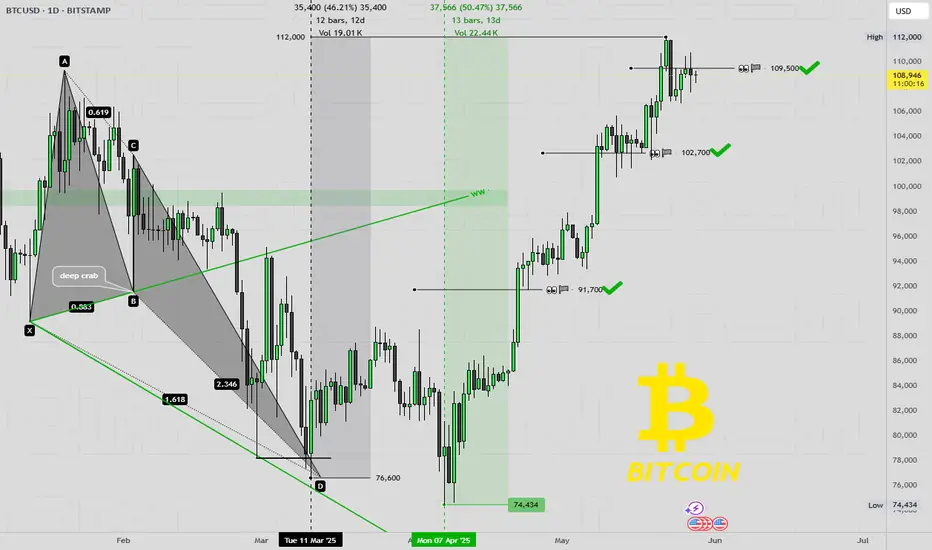
🖥daily-chart (BITSTAMP) and 💡everything important in the chart 👀
💥Here in the daily chart (BITSTAMP)
- a Deep-Crab harmonic with
- a WolveWave
and the daily-chart of the
🔥Daily MA200 re-test 👀
- gap fill
- support-line 2022 and 2024 TOPs
👉 BITCOIN roadmap/outlook (from 27th february 2024) 💡
🎯 If you like this idea, please leave me a 🚀 and follow for updates 🔥⏰
Furthermore, any criticism is welcome as well as any suggestions etc. - You're also very welcome to share this idea.
Have a nice evening & successful trading decisions 💪
M_a_d_d_e_n ✌
NOTE: The above information represents my idea and is not an investment/trading recommendation! Without any guarantee & exclusion of liability!
recap - " Bitcoin reversal confirmed ?! "BITCOIN reversal confirmed?! 👀
BITSTAMP:BTCUSD
How did this idea develop? 🤔
🥇Recap of the idea(s) from March 14, 2025 (see right 👀 under “Related Publications”)🎯
Hello ❤TradingView Community 👋
After the sell-off/correction ended on April 7, 2025' - Bitcoin reached an absolute low of $74434. This was followed by a nice rally and the complete fulfillment of the price targets from the idea of March 14, 2025 (push the play-button 😍).
Everything important is in the chart!
💡 This idea is closed at this point ✔
👉 All targets have been achieved 🎯💪
💥Follow me to stay up to date and be the first to receive these important updates/news & not miss anything! ⏰🔔
Furthermore, any criticism and suggestions etc. are welcome. - Feel free to share this idea.
Have a nice day & happy trading folks 🔥💪
M_a_d_d_e_n ✌
NOTE: The above information represents my idea and is not an investment/trading recommendation! No guarantee & exclusion of liability!
👉 BITCOIN roadmap/outlook (from 27th february 2024) 💡
A double sell pattern on HK50 at price21000 to 21100
Why?
1) This pair is still in a downtrend both of H4 and D1
2) We can see the pair had a pattern earlier yesterday for a sell, now it is a type 2
3) There is another pattern forming for the sell off around the same area
We will observe for another 1 hour to get the best price to enter.
The target if everything falls again would be 1:10 Risk to reward.
A short on S&P at 5770S&P has been moving up quick strongly over the past few days. It has reached a level that is a strong resistance and we will show this pair today.
1) There is deep crab pattern
2) H1 is overbought
3) There is RSI divergence on M15, M30 and H1
We will take profit when RSI is oversold.
Selling FTSE at the all time high of 8690The FTSE has reached a critical level and looks ready to come down.
1) There is a double top on D1 with Divergence
2) There is a huge pattern to sell for the 2nd time and target 8260 area
3) There is a smaller pattern to sell as well with a smaller stop loss.
We will take this trade with a smaller stop loss and the big target. This will be a long term trade that may take time to materialize but we will actively monitor it for profits.
AXA: Bearish -DEEP CRAB detected.AXA: Lower-DEEP CRAB detected.
(1)
In Weekly:
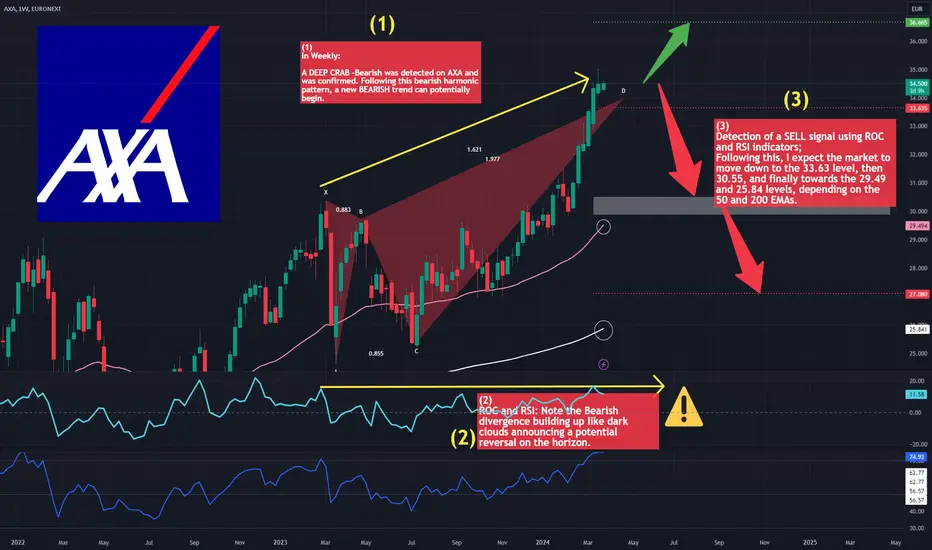
A DEEP CRAB -Bearish was detected on AXA and was confirmed. Following this bearish harmonic pattern, a new BEARISH trend can potentially begin.
(2)
ROC and RSI: Note the Bearish divergence building up like dark clouds announcing a potential reversal on the horizon.
(3)
Detection of a SELL signal using ROC and RSI indicators;
Following this, I expect the market to move down to the 33.63 level, then 30.55, and finally towards the 29.49 and 25.84 levels, depending on the 50 and 200 EMAs.
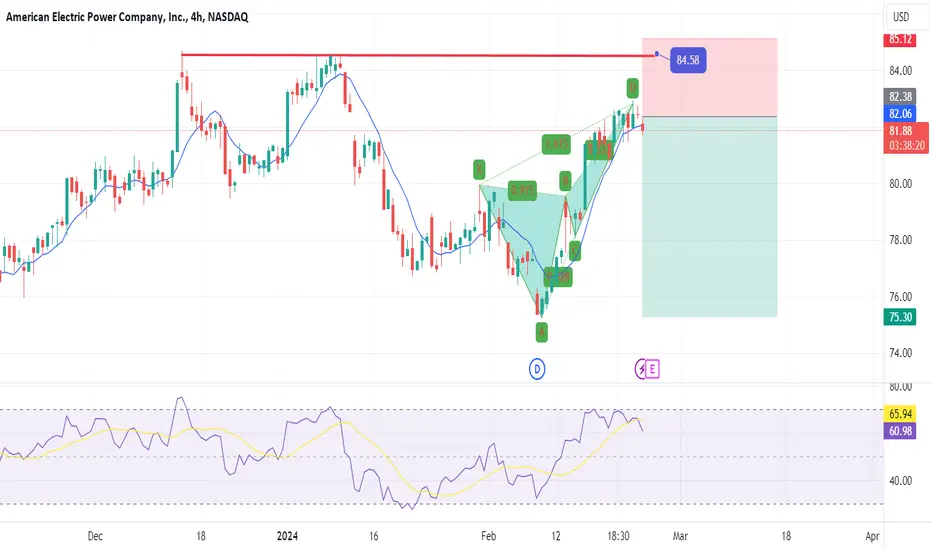
How will AEP react to it's results on Feb 27th? We are taking a short position on AEP before it's results.
1) There is a nice deep crab pattern on H4
2) The H4 is overbought
3) There is a double top
4) Divergence is present
This is a purely technical view and we expect the news to be bearish for AEP.
Stop loss above 84.50
Target 73.
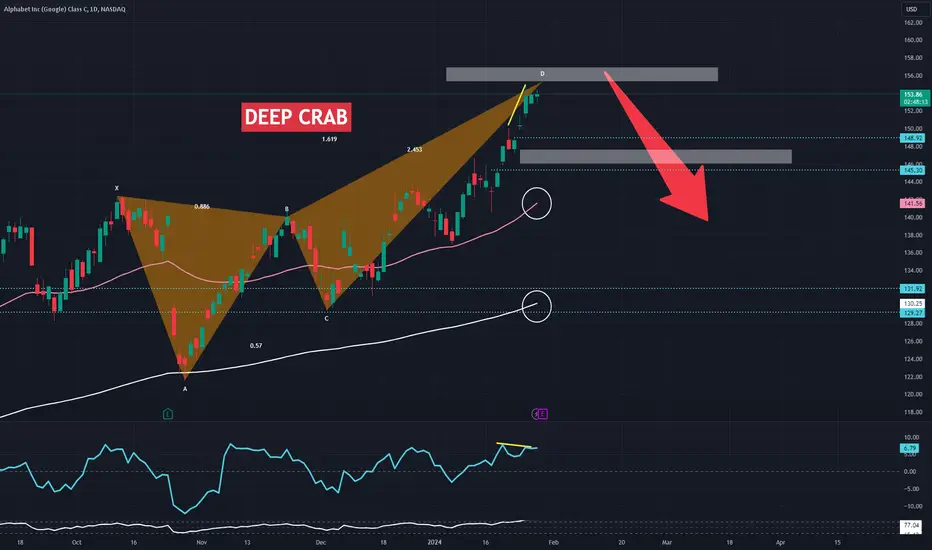
GOOGLE: Bearish - DEEP CRAB "on the Menu": Wolf Alert.GOOGLE: Bearish - DEEP CRAB "on the Menu": Wolf Alert.
GOOGLE results coming out tomorrow
However according to my technical analysis, the action should fall back to the white rectangle zone, towards 146, according to ICHIMOKU and the "Kijun"
+ slight divergence on R.O.C
Monitor GAPs as they can be potential targets, stick the EMA.50 and EMA.200
DAX (M15): Bearish -DEEP CRAB detectedDAX (M15): Bearish -DEEP CRAB detected
The price could reach 17 145 according to Fibonacci retracements, before falling to 16 875, then 16 690
American PMIs could influence this movement
Monitor the 50 and 200 Exponential Moving Averages
A BUY put strategy on MARCH or JUNE is possible
stay careful
AUDJPY: BAMM Breakout Headed for a 50% RetraceI suspect as the Japanese Carry trade is pressured, that there will be an effort made by institutions to convert to AUD in anticipation of Australian Interest Rates potentially rising above US Interest Rates, this would revive the more traditional Australian Carry Trade and serve to reduce the downwards pressure put on the Japanese carry trade while also reducing their overall leverage and should allow them to prolong the Bull Market in equities at least until the spring. Meantime the conversion to AUD should Temporarily push the value of the AUD up higher and given how much leverage would be going from JPY to AUD, I'd suspect the rise we see in AUD to be a bit on the extreme side which could lead to us very quickly seeing AUDJPY reach the more macro Fibonacci retraces between 139 JPY to 191.567 JPY.
Will the S&P finally turn at 4850? The bullish run of the S&P is really hard to believe. From the low of 4100, it has posted a return of close to 20% over the last 3 months.
The market will always have correction, so we need to understand what is the best place to take a counter trend.
There is a big pattern to sell at the current price, but the stop loss needs to be above 5000.
The risk to reward is really good aiming for 4290.
Let's hope the pattern holds and the market will correct for more buying opportunity.
BTC 12HR etc High Time Frame Bearish Deep Crab and BATI've been looking at this pattern for a while now, waiting to see if price would get to this point. It has. There is a Bearish Deep Crab and Bat on High time frames on BTC. Oscillators in conjunction with these patterns are a sign of a reversal soon. With the Fed meetings next week, this seems all too well timed. Be prepared. Thank you for viewing.